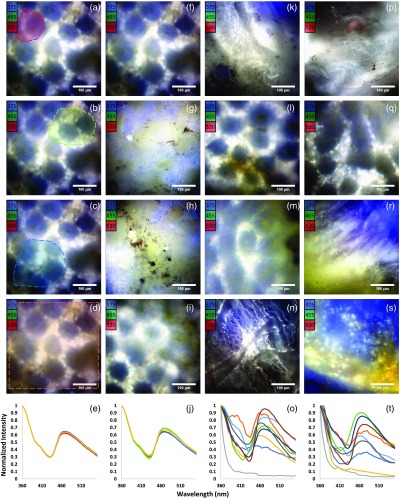
Fig. 5.
Spectral characteristics of image data. (a)–(d) A representative false-colored normal colon specimen image and an overlaid region (shown by dashed line) with varying sizes and locations selected to examine for spectral variability within the image. (e) Color-coded plot of the selected regions where the color of each line in the plot presents the average signature within the correspondingly colored region in panels (a)–(d). (f)–(i) Four different FOVs of the same normal colon specimen selected to determine spectral variability within the representative specimen. (j) Average spectral response of (f) (red), (g) (green), (h) (blue), and (i) (orange). (k)–(n) Example FOVs from normal specimens from four different patients. (o) Average normal colon specimen spectral response of each patient in the study. (p)–(s) Representative FOVs from neoplastic specimens from four different patients. (t) Average neoplastic spectral response of each patient in the study.

