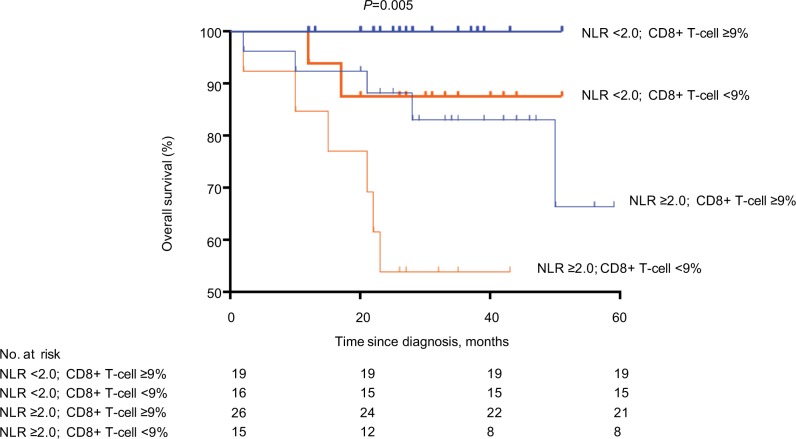
Figure 2.
Survival curves of patients with low NLR and high CD8+ T-cell count (n=19), low NLR and low CD8+ T-cell count (n=16), high NLR and high CD8+ T-cell count (n=26), and high NLR and low CD8+ T-cell count (n=15).
Note: The analysis was conducted by Kaplan–Meier method.
Abbreviation: NLR, neutrophil-to-lymphocyte ratio.

