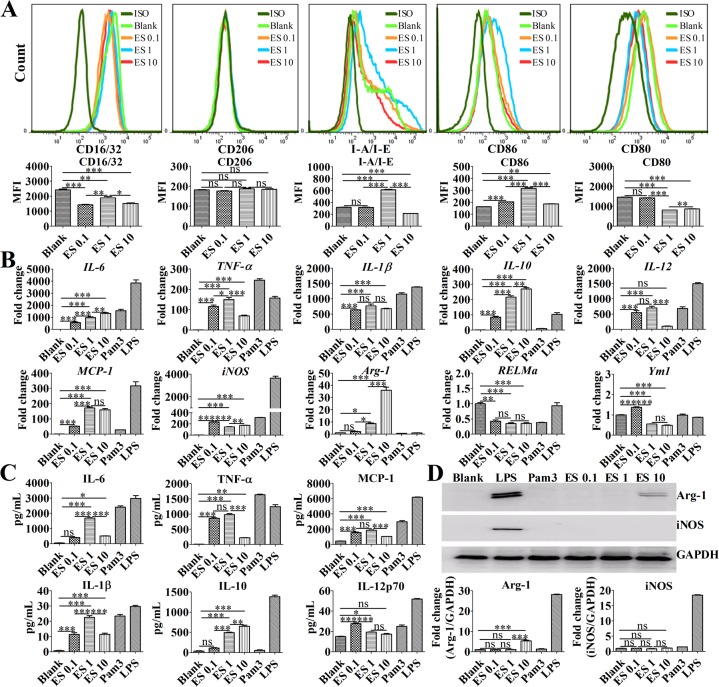
Fig 1. ES induces macrophage M2b polarization in vitro.
BMDMs were simulated with 0.1 μg/mL ES (ES 0.1), 1 μg/mL ES (ES 1), 10 μg/mL ES (ES10), 100 ng/mL LPS, 4 μg/mL Pam3CSK4 (Pam3), or DMEM. (A) Representative flow cytometry histograms and MFI (median fluorescence intensity) of CD16/32, CD206, MHC class II, CD86, and CD80 expression on BMDMs after stimulation for 24 h. (B) Cellular mRNA levels of IL-6, TNF-a, IL-10, IL-12, IL-1β, MCP-1, iNOS, Arg-1, RELMa, and Ym1 in BMDMs treated with various antigens or media control for 4 h were analyzed by RT-qPCR. (C) The levels of IL-6, TNF-α, IL-1β, IL-10, IL-12p70, and MCP-1 in supernatants of BMDMs after stimulation for 24 h were measured by an ELISA. (D) The levels of iNOS and Arg-1 protein expression in the lysates of BMDMs after stimulation for 24 h were examined by Western blot. Graphical representations of the band intensities are shown in the pictures below. The expression of iNOS and Arg-1 was normalized to GAPDH expression. The data are the result of a representative experiment out of three independent experiments and analyzed with one-way ANOVA. *P < 0.05; **P < 0.01; ***P < 0.001; ns, not significant.

