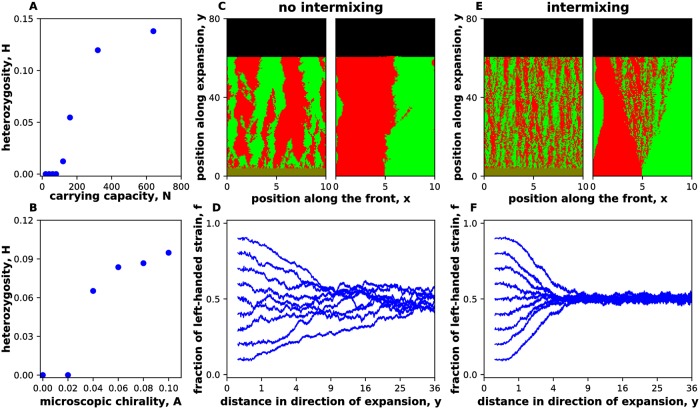
Fig 8. Transition from segregation to strain intermixing.
The intermixing of the strains was quantified by heterozygosity H = 〈2f(1 − f)〉, which is nonzero only when both strains are present at the same spatial location. (A,B) show that there is a phase transition between an intermixed regime, where H has a nonzero value at steady state, and a regime, where the strains spatially segregate with H vanishing in the long-time limit. The transition is controlled by the relative magnitude of strain chirality and the strength of genetic drift. The latter depends on the number of the organisms at the growing edge. (C) shows the spatial patterns in the demixed regime starting either from a single boundary or from well-mixed initial conditions. (D) shows how the relative abundance of the strains change starting from well-mixed initial conditions and different initial fractions. Note that, even in the demixed regime, there is negative frequency-dependent selection towards coexistence. (E,F) are the same as (C,D) but in the intermixed regime. All data in this figure are for strains with opposite handedness, but equal magnitude of chirality. Similar results were obtained for unequal magnitudes of chirality; see S4 Fig. Here, m0 = ms = mb = md = 0, g = 0.1 for both strains. In panels (A), (C), (D), (E), (F), , , , on a lattice of 1000x8000 sites with N = 40 and N = 320 for no intermixing and intermixing respectively. In (B) , N = 200 was held fixed as chirality was varied. All distances were measured in 100 units where Δx = Δy = 1 unit. The right-handed strain is shown in red, and the left-handed strain is shown in green. Note that the equilibration of H requires that f is in steady state; therefore, H equilibrates more slowly.

