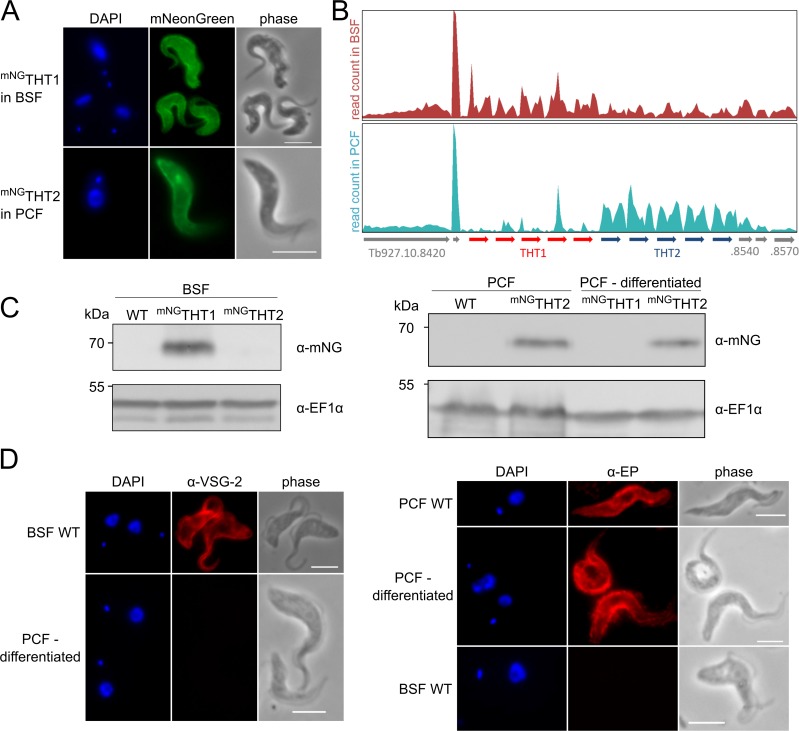
Fig 1. Glucose transporters localise to the cell surface and are developmentally regulated.
(A) Fluorescence microscopy analysis. mNGTHT1 and mNGTHT2 localise to the cell surface in bloodstream and insect stage T. brucei, respectively, as shown by direct mNeonGreen (mNG) fluorescence. (B) Differential RNA-seq expression analysis of THT1 and THT2 genes in BSF and PCF showing developmental control. Total number of reads at the THT1/THT2 locus, applying an uniqueness filter of MapQ>1, are depicted using the Artemis genome browser [66]; raw transcriptomic data was derived from Hutchinson et al [30]. (C) Western blot analyses indicating stage specific expression of in situ tagged mNGTHT1 and mNGTHT2 in BSF (left) and PCF and cells differentiated in DTM medium (right). WT, wild-type; EF1α serves as a loading control. (D) Differentiation in DTM medium of mNGTHT expressing cells (mNGTHT2 cells shown) was validated by immunofluorescence microscopy with stage specific surface markers, VSG-2 for BSF and EP procyclin for PCF. In A and D, DNA was counter stained with DAPI; Scale bars 5 μm.

