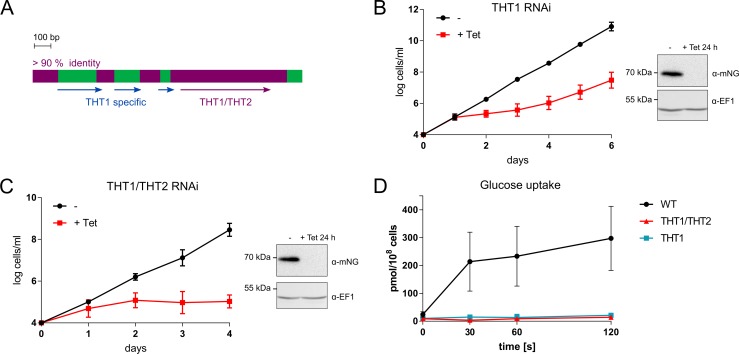
Fig 2. The glucose transporters are essential for growth in vitro.
(A) The scheme shows the relationship between THT1 and THT2 genes. >90% identical regions are depicted in plum and THT-specific regions are in green. The arrows indicate the regions used for RNAi. (B) The growth curves show the THT1 RNAi cell line without and with tetracycline induction. Data points are means of two independent experiments with two biological replicates, error bars, SD. The protein blot shows depletion of native tagged mNGTHT1 in the same cell line 24 h after tetracycline induction. (C) The growth curves show THT1/THT2 RNAi cell line without and with tetracycline induction. Data points are means of two independent experiments with two biological replicates, error bars, SD. The protein blot shows depletion of native tagged mNGTHT1 in the same cell line 24 h after tetracycline induction. (D) An uptake assay for [14C]2-deoxyglucose showing that this glucose analogue is taken up by wild-type (WT), but not THT1 and THT1/THT2 induced RNAi cells after 3 days tetracycline induction (n = 3). Error bars, SD.

