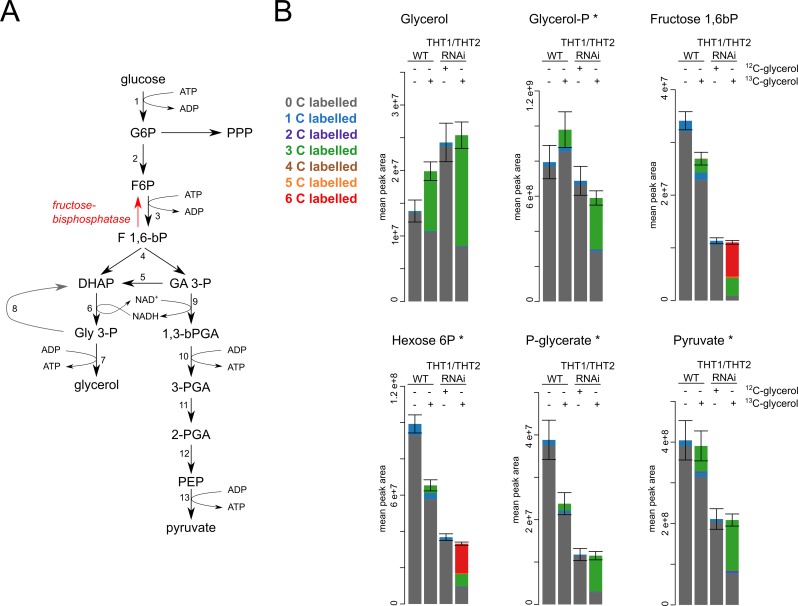
Fig 4. Gluconeogenesis in trypanosomes growing on glycerol.
(A) A scheme of glycolysis and gluconeogenesis with highlighted fructose-1,6-bisphosphatase. PPP, pentose phosphate pathway; 1, hexokinase; 2 glucose-6-phosphate isomerase; 3, phosphofructokinase; 4, fructose-bisphosphate aldolase; 5, triose-phosphate isomerase; 6, glycerol-3-phosphate dehydrogenase; 7, glycerol kinase; 8, mitochondrial glycerol-3-phosphate dehydrogenase; 9, glyceraldehyde-3-phosphate dehydrogenase; 10, phosphoglycerate kinase; 11, phosphoglycerate mutase; 12, enolase; 13, pyruvate kinase. (B) Metabolites from glycolysis/gluconeogenesis as detected in the LC-MS analysis. The size of the bars represents the total abundance, and coloured parts indicate 13C labelling as depicted in the key. The samples are from WT cells, WT grown in 13C-glycerol, THT1/THT2 RNAi grown in 12C-glycerol and THT1/THT2 RNAi grown in 13C-glycerol. Glucose was also present for all experiments. Natural abundance of 13C is 1%, hence the 1C labelling in ‘un-labelled’ samples that is proportional to the number of carbons in each metabolite. * identity of these metabolites was confirmed using a match with a standard.

