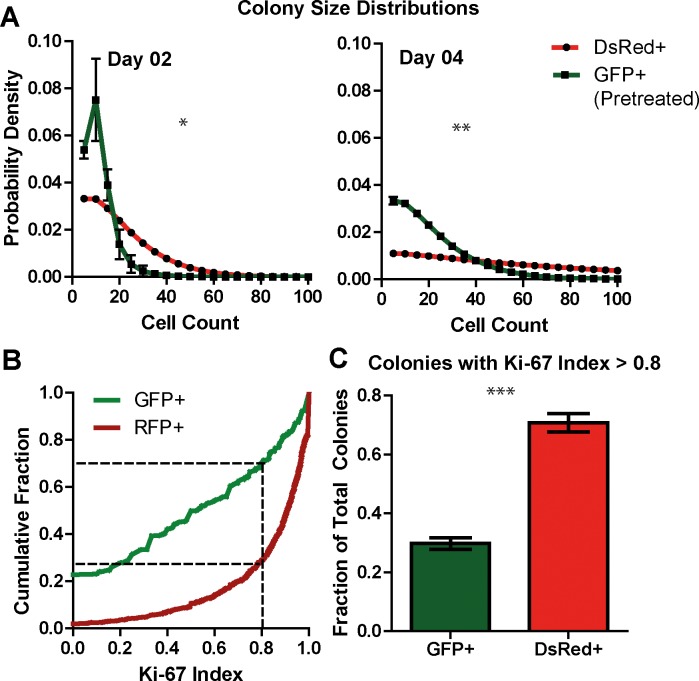
Fig 4. In vitro results.
A: Colony size distributions 2 days and 4 days after plating. The Y-axis shows probability density (relative probability) and the X-axis shows colony size in number of cells. Mean and standard deviations are shown for populations of colonies (n >150, per well) obtained from a set of 3 wells of a 6 well-plate and represent biological replicates. Significance was determined using the two-tailed Wilcoxon rank-sum test. B: Cumulative frequency distribution of Ki-67 index over a population of colonies (n >150, per well) obtained from a set of 3 wells of a 6 well-plate. Dashed lines show Ki-67 index value of 0.8. C: Fraction of cells with Ki-67 index > 0.8, showing mean and standard error over 3 wells. Significance was determined using unpaired t-test. * p<0.05, ** p<0.01, *** p<0.001.

