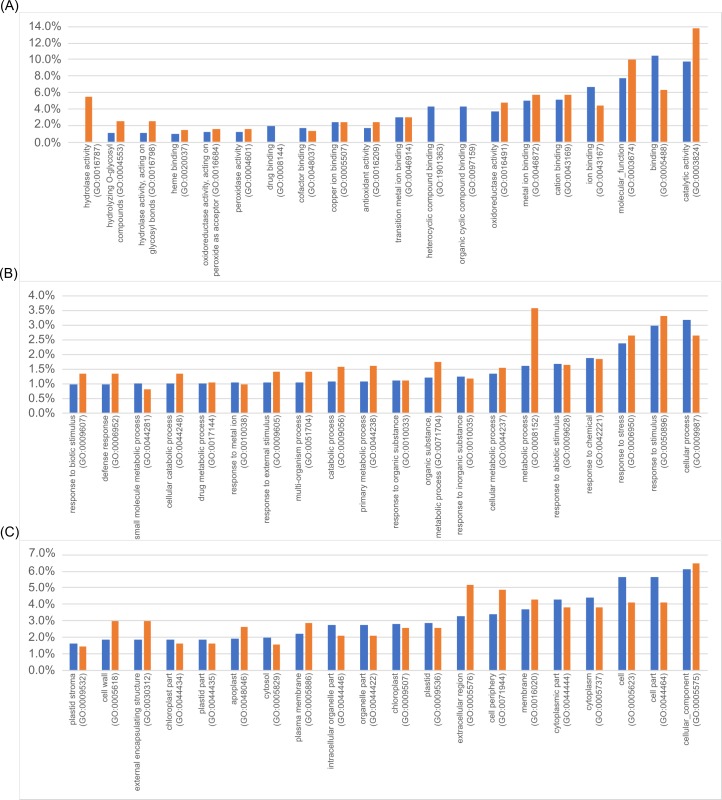
Fig 1. GO enrichment analysis of the secretomes.
All identified plant proteins were analysed using the GO term analysis tool using AmiGO (http://www.geneontology.org, version 1.8) and sorted according to the categories of biological processes (A), molecular functions (B) and cellular components (C). The 20 most abundant GO terms are presented here (in percentage). Blue bars indicate the frequency of this GO term in single cultures, orange bars indicate the frequency of the respective GO term in co-cultures.

