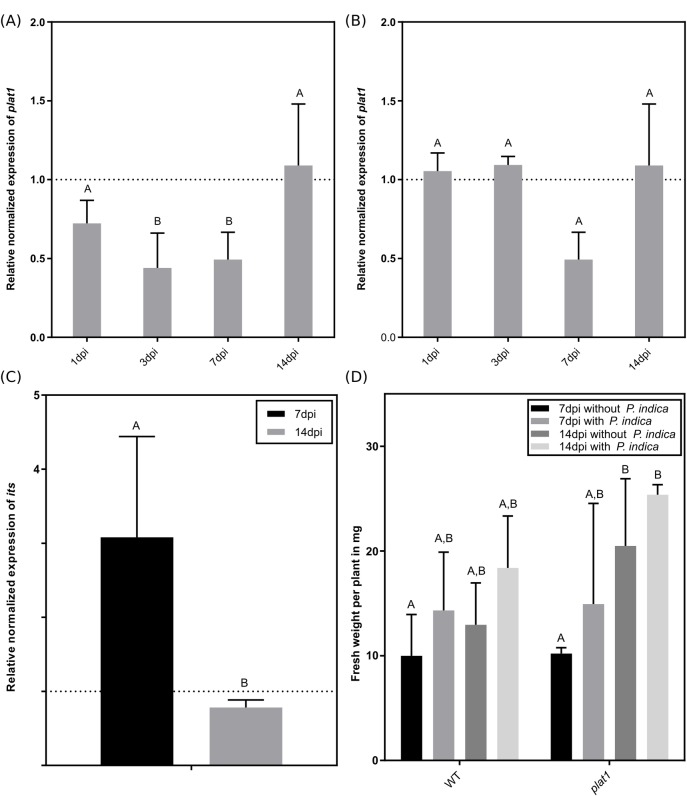
Fig 3. Characterisation of plat1 mutant and plat1 gene expression.
Gene expression of PLAT1 in WT roots (A) and leaves (B) was determined between one day and 14 days of colonisation. The dashed line represents levels of mRNA in uncolonised WT roots. (C) Colonisation of P. indica in WT and plat1 roots determined by RT-qPCR. The dashed line represents the level of fungal internal transcribed spacer (its) mRNA in colonised WT roots after one and two weeks, respectively. At 7dpi (days post inoculation) the plat1 mutant was significant stronger colonised compared to WT plants. (D) Effect of P. indica on fresh weight in WT and different mutant A. thaliana plants after one and two weeks of colonisation. All experiments were repeated three to six times with at least ten plants each. Error bars represent standard deviation. Different letters represent significant differences between treatments at p<0.05 (Two-Way ANOVA, followed by a Bonferroni correction).

