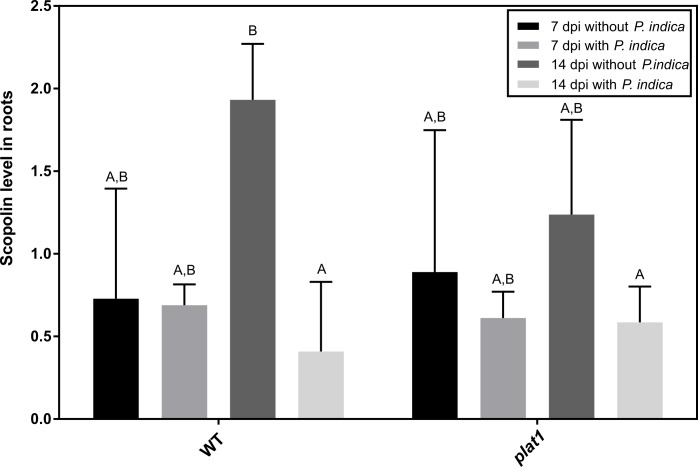
Fig 6. Characterisation of plat1 mutant and plat1 gene expression.
First, we determined the scopolin levels in root of WT and plat1, and the peak areas of HPLC chromatograms were normalised by an internal standard. All experiments were repeated four to five times with at least ten plants each. Error bars represent standard deviation. Different letters represent significant differences between treatments at p<0.05 (Two-Way ANOVA, followed by a Bonferroni correction).

