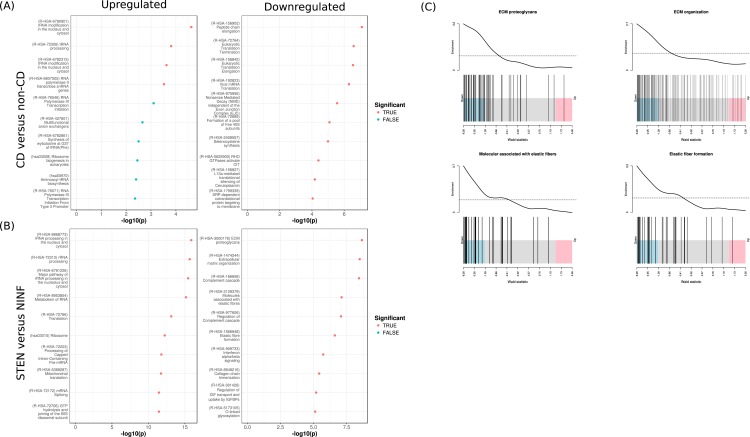
Fig 3. Enrichment analyses of the DEGs.
Enrichment analyses results when comparing (A) CD with non-CD and (B) STEN with NINF. Top 10 enriched pathways for up- and downregulated genes on the left and right, respectively. (C) Barcode plots depicting the gene enrichment for ECM-associated pathways: “Molecules associated with elastic fibers”, “Elastic fiber formation”, “ECM proteoglycans”, and “Extracellular matrix organization”.

