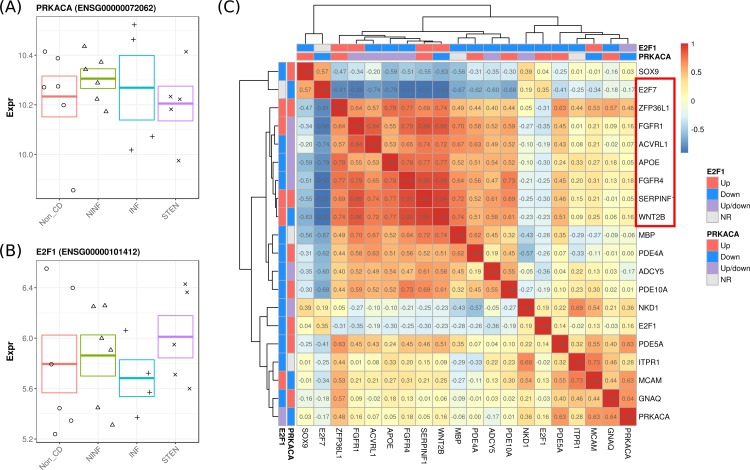
Fig 6. Overview of the PRKACA/E2F1-associated genes.
Jitter plot representing the gene expression for the highly-interconnected genes (A) PRKACA and (B) E2F1. Error bars represent the standard error. (C) Heatmap representing the pairwise gene correlation coefficients for the genes linked to PRKACA and E2F1. Colored bars above the heatmap represent the relationship of the genes with PRKACA and E2F1, where upstream genes (‘Up’) are represented in red, downstream genes (‘Down’) in blue, up and downstream genes (‘Up/down’) in purple, and genes with no relationship (‘NR’) in grey. Highlighted in red are the genes whose absolute inter-gene correlations are higher than 0.7.

