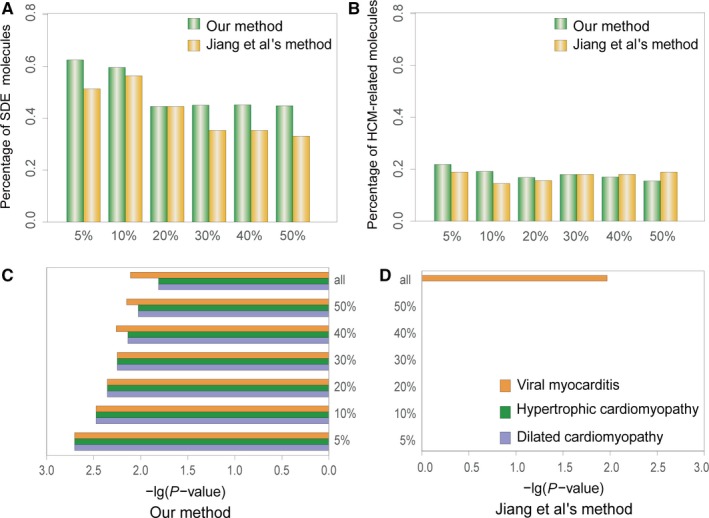
Figure 2.

Comparison of our method and Jiang et al.'s method in top 5%, 10%, 20%, 30%, 40%, 50% dysregulated FFLs. (A) The distribution of SDE molecules. (B) The distribution of HCM‐related molecules. (C and D) The distribution of significantly enriched subpathways
