Figure 3.

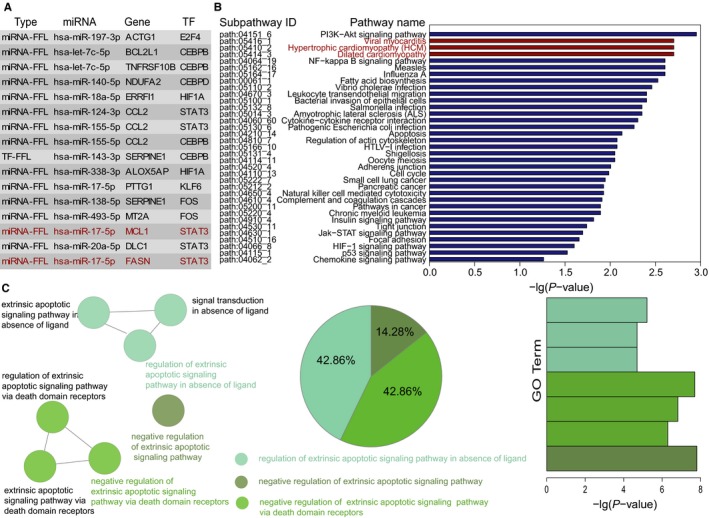
The top 5% dysregulated FFLs and their functional analysis. (A) The top 5% dysregulated FFLs. The red coloured FFLs denote the FFLs mentioned later. (B) Significantly enriched KEGG subpathways. The red coloured pathways denote that they belong to cardiovascular disease pathways in KEGG. (C) Significantly enriched GO terms. The similar GO terms are labelled in the same color
