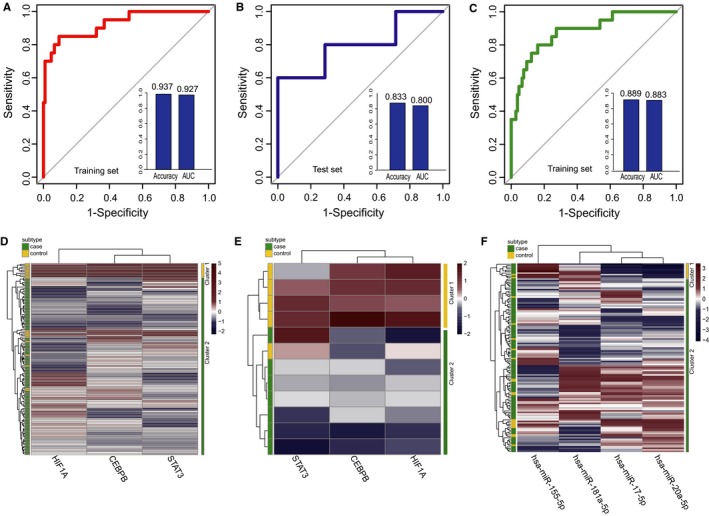
Figure 6.

Classification performance of the identified two panel diagnostic biomarkers defined by TFs and miRNAs in HCM based on 5‐fold cross‐validation analysis. (A and B) Performance evaluation of three TFs diagnostic biomarkers in the training set and test set, respectively. (C) Performance evaluation of four miRNAs diagnostic biomarkers in training set. (D and F) The hierarchical clustering heat map of 126 samples based on expression profiles of three TFs and four miRNAs in training set, respectively. (E) Hierarchical clustering heat map of 12 samples based on expression profiles of three TFs in test set
