
Figure 2.
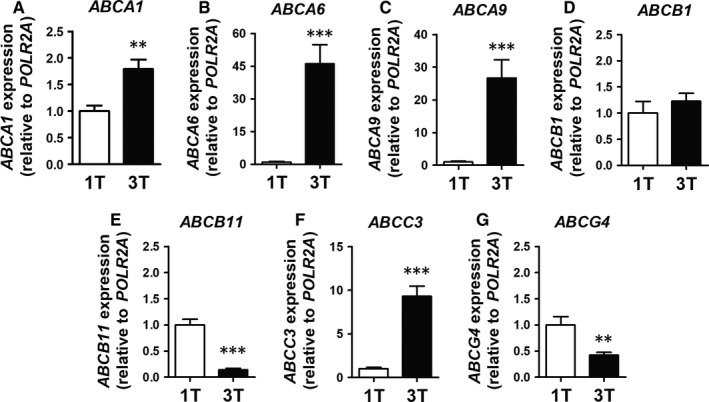
Validation of selected ABC genes by qPCR. (A) ABCA1; (B) ABCA6; (C) ABCA9; (D) ABCB1 (E); ABCB11; (F) ABCC3; and (G) ABCG4 mRNA expression, comparing first trimester (n = 8) and term (n = 12) placentae. Statistical analyses: non‐parametric Mann‐Whitney test. Data are presented as mean ± SEM. **P < 0.01 and ***P < 0.001