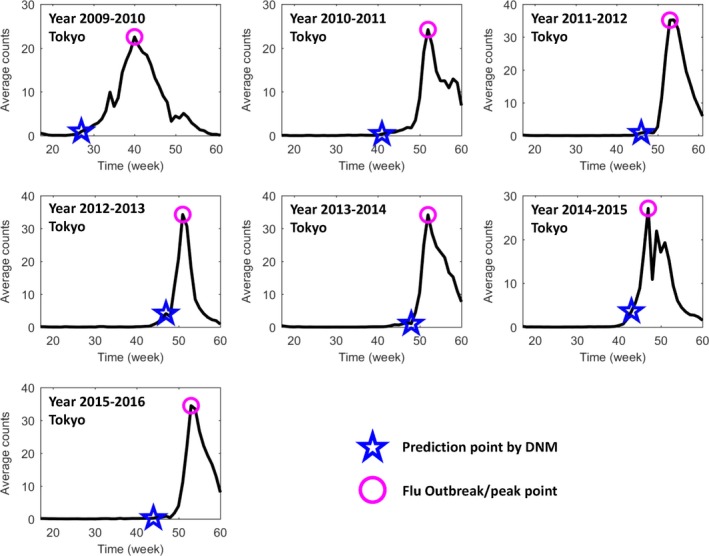
Figure 3.

The prediction of annual seasonal influenza outbreak in Tokyo city between the years 2009 and 2016. Based on the public historical information of flu‐caused hospitalization between 1 March 2009 and 31 March 2016 in Tokyo, Japan, each seasonal influenza outbreak is predicted by DNM. The DNM score was calculated based on a 5‐wk sliding window scheme. In each figure, the y‐axis is the average number of patients in each clinic; the x‐axis represents a period spanning from the 17th week (the first week in May) to the 60th or 61st week (the last week in March). There are 52 weeks in years 2009 and 2011, and 53 wk in other years. The pink circle points to the peak of average patient counts, ie, the flu outbreak, and the blue star mark indicates the first warning time (tipping point) signalled by the DNM score. Clearly, DNM is able to predict the outbreak before the drastic increase of the patients
