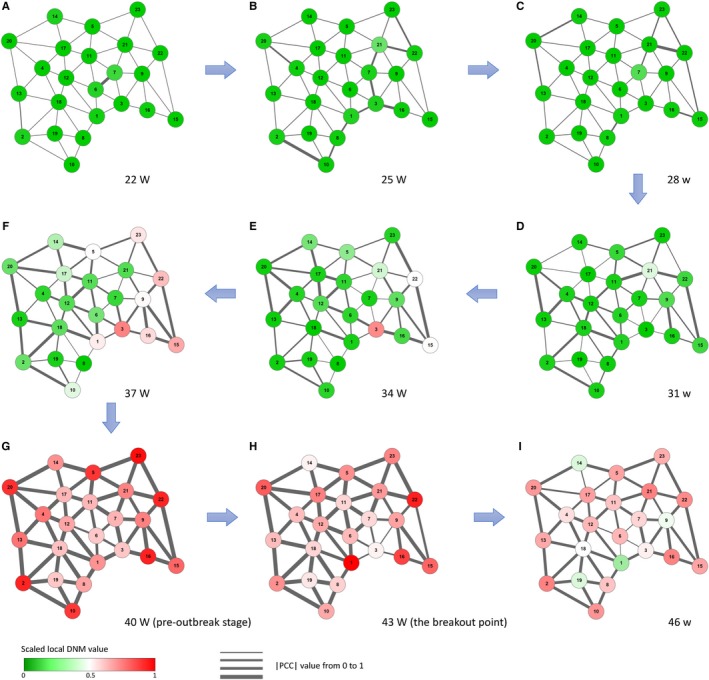
Figure 5.

The dynamical evolution of flu‐progression network in Tokyo. Based on the local DNM scores for 23 wards in Tokyo during the year 2014, the dynamical evolution of flu‐progression network is presented, i.e., networks respectively in (A) the 22nd wk, (B) the 25th wk, (C) the 28th wk, (D) the 31st wk, (E) the 34th wk, (F) the 37th wk, (G) the 40th wk, (H) the 43rd wk, and (I) the 46th wk. The nodes are coloured by the scaled value of local DNM score, while the thickness of the edges represents the correlation between a pair of adjacent wards in Tokyo. It can be seen that there is no significant changes in the network (eg, the 22nd‐34th week) far from the flu outbreak caused by influenza A virus H3N2 in the 43rd week. However, when the system approaches the outbreak point (eg, the 40th week), there are tremendous changes in both nodes and edges, reflecting the obvious early‐warning signals of the upcoming outbreak, provided by the DNM system
