Figure 1.

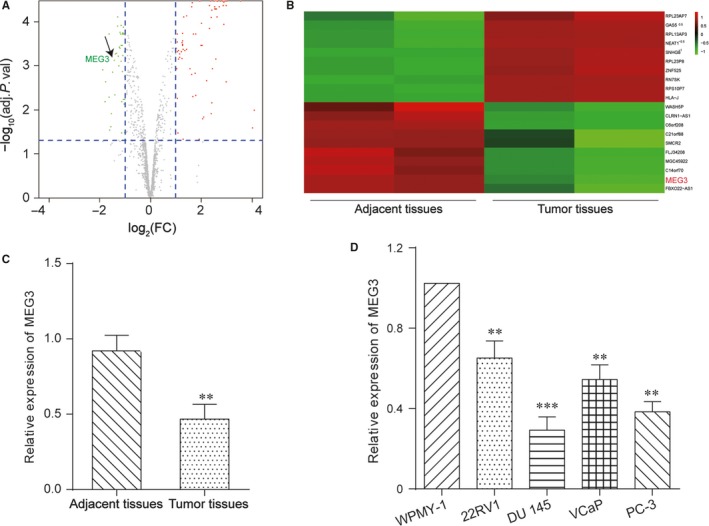
LncRNA MEG3 was down‐regulated in prostate cancer. A, The volcanic map showed some of the differentially expressed lncRNAs between prostate cancer tissues and adjacent tissues. B, The heat map showed lncRNA MEG3 was down‐regulated. C, The expression level of MEG3 was decreased in PCa tissues by qRT‐PCR. **P < .01, compared with adjacent tissues. D, The expression level of MEG3 was down‐regulated in prostate tumour cell lines (22RV1, DU 145, VCaP and PC‐3) by qRT‐PCR. **P < .01, ***P < .001, compared with WPMY‐1 cells
