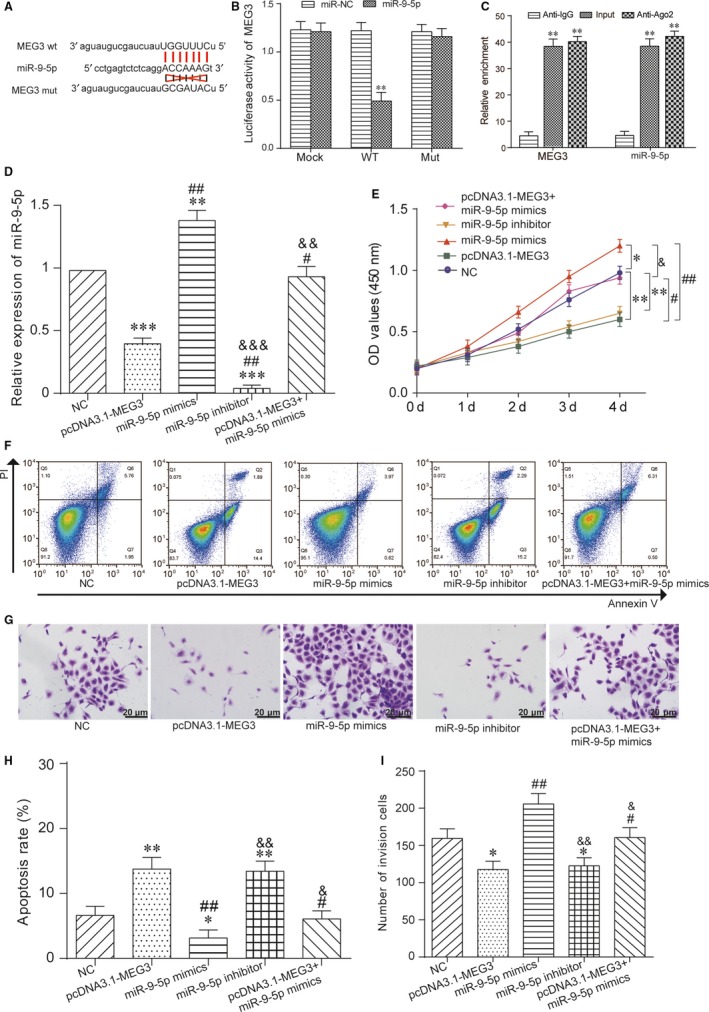
Figure 3.

MEG3 served as a sponge of miR‐9‐5p and inhibited prostate cancer. A, The targeting relationship between MEG3 and miR‐9‐5p. B, The luciferase intensity of DU 145 cells transfected with MEG3 wild‐type and miR‐9‐5p was significantly reduced. **P < .01, compared with miR‐NC group. C, The interaction between MEG3 and miR‐9‐5p was detected by RNA immunoprecipitation (RIP) with Ago2 antibody. D, The expression of miR‐9‐5p in pcDNA3.1‐MEG3 group was reduced, whereas miR‐9‐5p mimics group was increased. The miR‐9‐5p expression level in the miR‐9‐5p inhibitor group was the lowest. **P < .01, ***P < .001, compared with NC group, # P < .05, ## P < .01, compared with pcDNA3.1‐MEG3 group, && P < .01, &&& P < .001, compared with miR‐9‐5p mimics group. E, CCK‐8 assay showed that the miR‐9‐5p mimics group exhibited higher cell proliferative capacity. Cell proliferative capacity of pcDNA3.1‐MEG3 group and miR‐9‐5p inhibitor group was decreased. *P < .05, **P < .01, compared with NC group, # P < .05, ## P < .01, compared with pcDNA3.1‐MEG3 group, & P < .01, compared with miR‐9‐5p mimics group. F, H, FCM assay revealed that cell apoptosis rate of pcDNA3.1‐MEG3 group and miR‐9‐5p inhibitor group were increased, whereas miR‐9‐5p mimics group was decreased. *P < .05, **P < .001, compared with NC group, # P < .05, ## P < .01, compared with pcDNA3.1‐MEG3 group, & P < .05, && P < .01, compared with miR‐9‐5p mimics group. G, I, Cell invasion ability of pcDNA3.1‐MEG3 group and miR‐9‐5p inhibitor group were decreased, whereas miR‐9‐5p mimics group was promoted by transwell assay. *P < .05, compared with NC group, # P < .05, ## P < .01, compared with pcDNA3.1‐MEG3 group, & P < .05, && P < .01, compared with miR‐9‐5p mimics group. Scale bar = 20 μm
