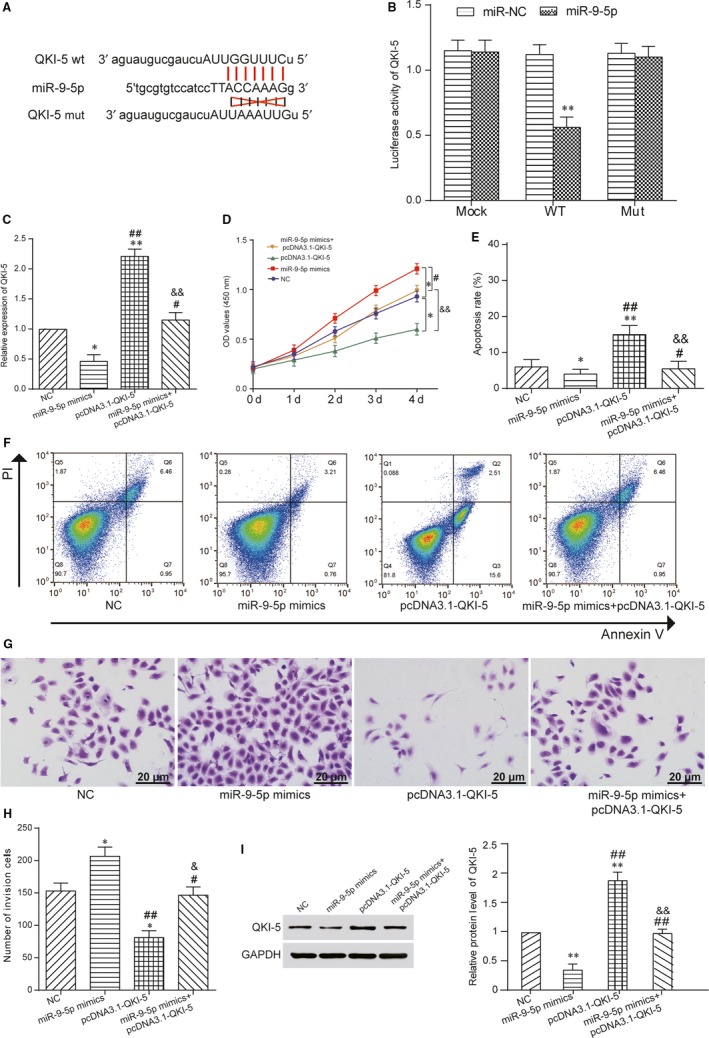
Figure 4.

MiR‐9‐5p regulated expression of QKI‐5. A, The targeting relationship between miR‐9‐5p and QKI‐5. B, The luciferase intensity of DU 145 cells cotransfected with QKI‐5 wild‐type and miR‐9‐5p was reduced. **P < .01, compared with miR‐NC group. C, The QKI‐5 expression level of pcDNA3.1‐QKI‐5 group was higher, whereas miR‐9‐5p mimics group was reduced by qRT‐PCR. *P < .05, **P < .01, compared with NC group, # P < .05, ## P < .01, compared with miR‐9‐5p mimics group, && P < .01, compared with pcDNA3.1‐ QKI‐5 group. D, The cell activity of miR‐9‐5p mimics group increased, whereas pcDNA3.1‐ QKI‐5 group was inhibited by CCK‐8 assay. *P < .05, compared with NC group, # P < .05, compared with miR‐9‐5p mimics group, && P < .01, compared with pcDNA3.1‐MEG3 group. E, F, The cell apoptosis rate of miR‐9‐5p mimics group was decreased, whereas pcDNA3.1‐QKI‐5 group was increased by FCM assay. *P < .05, **P < .01, compared with NC group, # P < .05, ## P < .01, compared with miR‐9‐5p mimics group, && P < .01, compared with pcDNA3.1‐ QKI‐5 group. G, H, Cell invasion ability of miR‐9‐5p mimics group was promoted, whereas pcDNA3.1‐QKI‐5 group was inhibited by transwell assay. *P < .05, compared with NC group, # P < .05, ## P < .01, compared with miR‐9‐5p mimics group, & P < .05, compared with pcDNA3.1‐QKI‐5 group. Scale bar = 20 μm. I, QKI‐5 expression level of miR‐9‐5p mimics group was decreased, whereas pcDNA3.1‐QKI‐5 group was increased detected by Western blot. **P < .01, compared with NC group, ## P < .01, compared with miR‐9‐5p mimics group. && P < .01, compared with pcDNA3.1‐QKI‐5 group
