Figure 5.

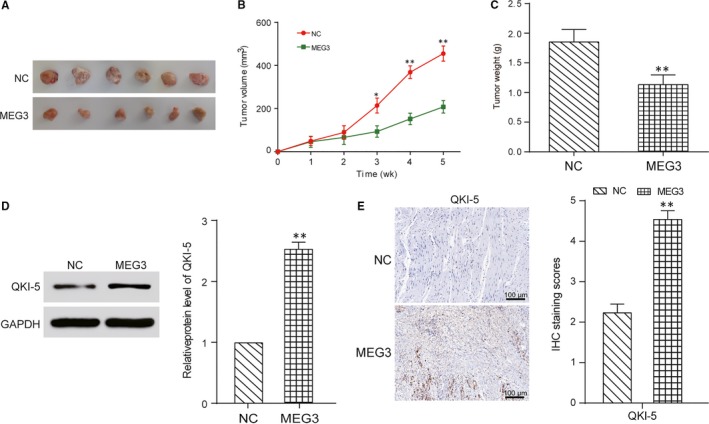
MEG3 inhibited prostate cancer in vivo. A, Photos of prostate tumour tissues after 5 weeks. B, The tumour size was smaller in the MEG3 group. *P < .05, **P < .01, compared with NC group. C, The tumour weight was lighter in the MEG3 group. **P < .01, compared with NC group. D, MEG3 overexpression increased expression level of QKI‐5 after 5 weeks detected by Western blot. **P < .01, compared with NC group. E, MEG3 overexpression increased expression level of QKI‐5 after 5 weeks detected by immunohistochemical analysis. **P < .01, compared with NC group. Scale bar = 100 μm
