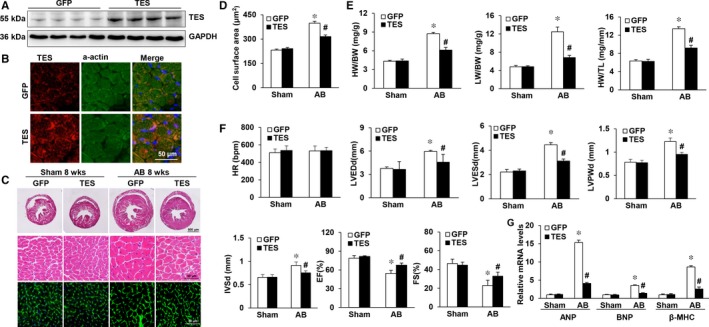
Figure 3.

Overexpression of TES in the heart attenuates pressure overload‐induced hypertrophy. A, Western blot analysis was utilized to verify excessive TES expression (n = 4). GFP denotes the AVV9‐GFP groups, while TES denotes the groups with excessive expression of TES. B, Immunofluorescence staining of TES and a‐actin in mouse hearts after 8 weeks of AVV9‐GFP or AAV9‐TES injection (n = 4). C, Histological examination of HE staining and WGA staining of GFP and TES mice 8 weeks after the AB operation (n = 5‐6). D, Statistical analysis of the cardiomyocyte cross‐sectional areas (n = 100 cells). E, Statistical analysis of the LW/BW, HW/TL, and HW/BW ratios in the indicated groups (n = 11‐14). F, Echocardiographic parameters of TES as well as GFP mice (n = 9‐13). G, RT‐PCR of BNP, ANP, and β‐MHC expression triggered by AB in the indicated mice (n = 4). *P < 0.05 vs GFP/sham; # P < 0.05 vs GFP/AB
