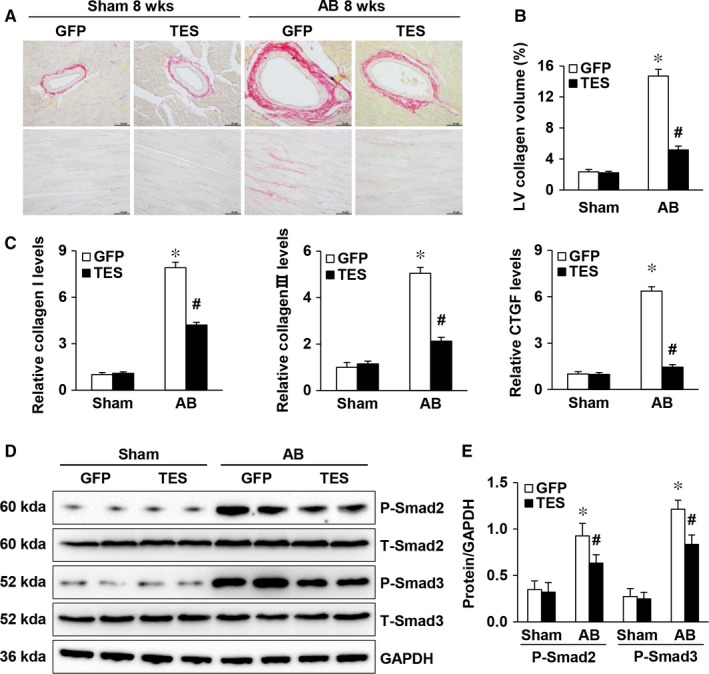
Figure 4.

TES overexpression attenuated fibrosis in pressure‐overloaded hearts. A, Picrosirius red staining of histological slices of LVs in the indicated groups 8 weeks after AB (n = 6, scale bar = 50 μm). B, An image analysis system was used to quantify the fibrotic area (n = 29‐33 fields). C, qPCR of markers of fibrosis (collagen I, CTGF, and collagen III) in the indicated mice (n = 4). D and E, Representative Western blot and quantification of total and phosphorylated Smad 2 and 3 proteins in the indicated groups (n = 4).*P < 0.05 vs GFP/sham; # P < 0.05 vs GFP/AB
