Figure 5.

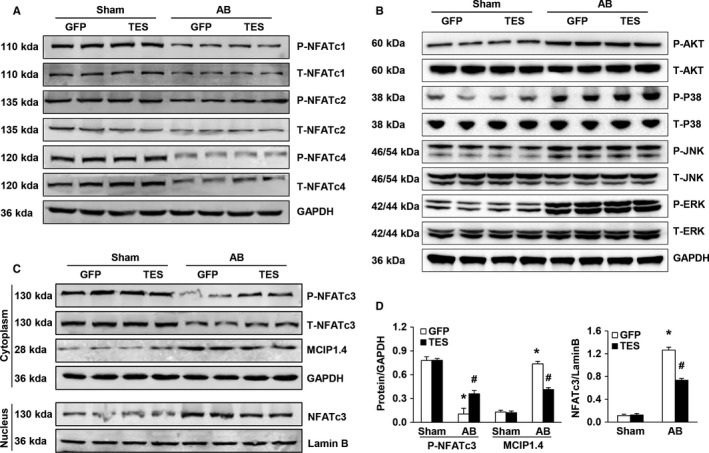
TES inhibited the calcineurin‐NFAT axis in murine hypertrophic hearts. A, Western blot of the total and phosphorylated protein concentrations of NFATc4, NFATc2, and NFATc1 in murine hearts in the indicated groups. B, Western blot of the total and phosphorylated protein concentration of MEK1/2, AKT, ERK1/2, P38, and JNK1/2 in murine hearts in the indicated groups. C and D, Representative Western blot and quantification of NFATc3 and MCIP1.4 protein levels in murine cytoplasm and nucleus in the indicated groups. (n = 4, *P < 0.05 vs GFP/sham; # P < 0.05 vs GFP/AB)
