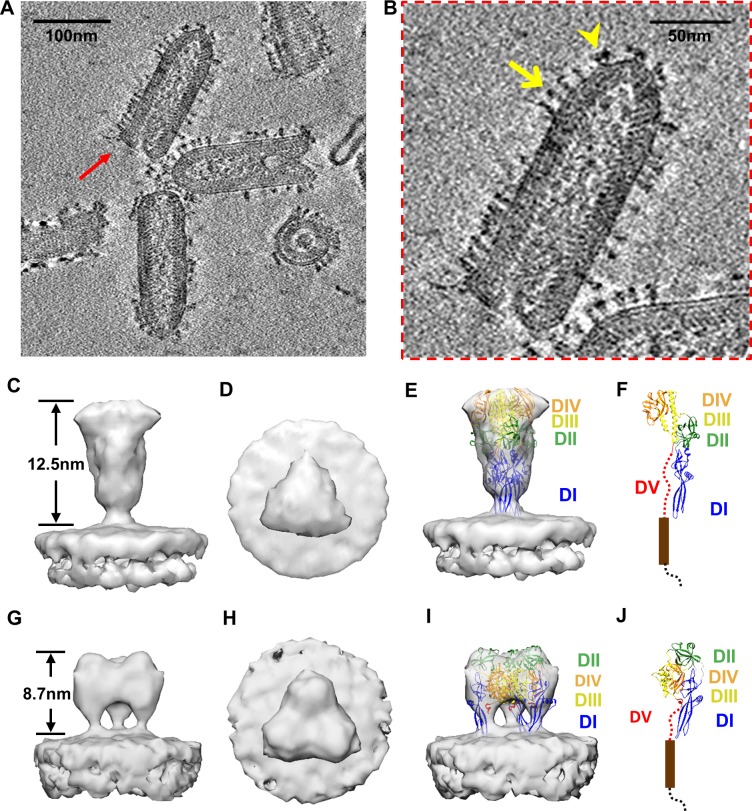
Fig 1. In situ structures of two distinct conformations of VSV G.
(A) A 10Å-thick slab from the tomogram showing bullet-shaped VSV virions. (B) The VSV particle indicated by red arrow in (A), with a yellow arrow pointing to long-form G and a yellow arrow head pointing to short-form G. (C~F) Subtomographic average of the long-form G densities, whose ectodomain matches the crystal structure of G in postfusion conformation. The subtomographic average of the long-form G densities is shown either as shaded surfaces viewed from side (C) and top (D), or as semi-transparent gray (E) fitted with crystal structure of the G trimer (ribbon) in the postfusion conformation (PDB: 5I2M) [20]. For clarity, one of the subunits is shown alone in (F) with five domains (DI~DV) indicated. (G~J) Subtomographic average of the short-form G densities, whose ectodomain matches the crystal structure of G in prefusion conformation. The subtomographic average of the short-form G densities is shown either as shaded surfaces viewed from side (G) and top (H), or as semi-transparent gray (I) fitted with crystal structure of the G trimer (ribbon) in the prefusion conformation (PDB: 5I2S) [21]. For clarity, one of the subunits is shown alone in (J) with five domains (DI~DV) indicated.

