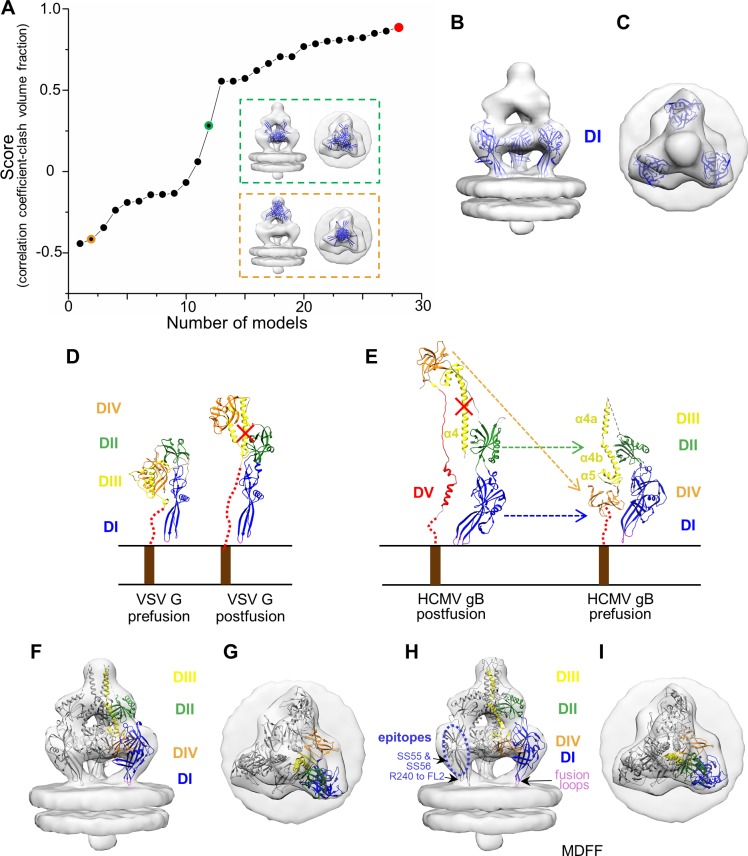
Fig 5. Domain fitting for prefusion gB.
(A~C) Domain fitting for DI. (A) Scores of 28 models for DI. Models are ranked in ascending order of scores. Red dot indicates the model of highest score. Dots with green and orange circles indicate the models of medium and low score, respectively. The DI models, superimposed in the subtomographic average of the Christmas tree-shaped density (semi-transparent gray) and viewed from side and top, are shown in green and orange dashed boxes next to the corresponding dots, respectively. (B, C) DI structure, indicated as red dot in (A), is superimposed in the subtomographic average of the Christmas tree-shaped density (semitransparent gray), viewed from side (B) and top (C). (D) VSV G domain rearrangement of crystal monomer structure from prefusion (left, PDB: 2J6J) [21] to postfusion (right, PDB: 2CMZ) [21]. The red dotted lines represent the unresolved domain DV between transmembrane helix and the ectodomain. (E) the crystal structure of one protomer of the postfusion HCMV gB ectodomain (left, PDB: 5CXF) [16] is shown as ribbon next to the predicted prefusion gB structure (right) with domains arranged according to those in the prefusion VSV G. α4 and α5 represent the long central helix and the following short helix in DIII in postfusion gB structure. α4a and α4b represent the two helix breaking from α4. Helices are labeled as in [16]. (F, G) The predicted prefusion gB structure shown in (E, right) is superposed with two other symmetric copies (gray ribbon) in the subtomographic average of the Christmas tree-shaped density (semi-transparent gray), viewed from side (F) and top (G). (H, I) The MDFF-simulated prefusion gB structure is superimposed with two other symmetric copies (gray ribbon) in the subtomographic average of the Christmas tree-shaped density (semi-transparent gray), viewed from side (H) and top (I). The epitopes of HSV-1 antibodies SS55/SS56 and R240 are DI and fusion loop 2 of HSV-1 gB, respectively ([26]); the corresponding locations of these two epitopes in our domain model of HCMV gB are indicated.

