
Figure 3.
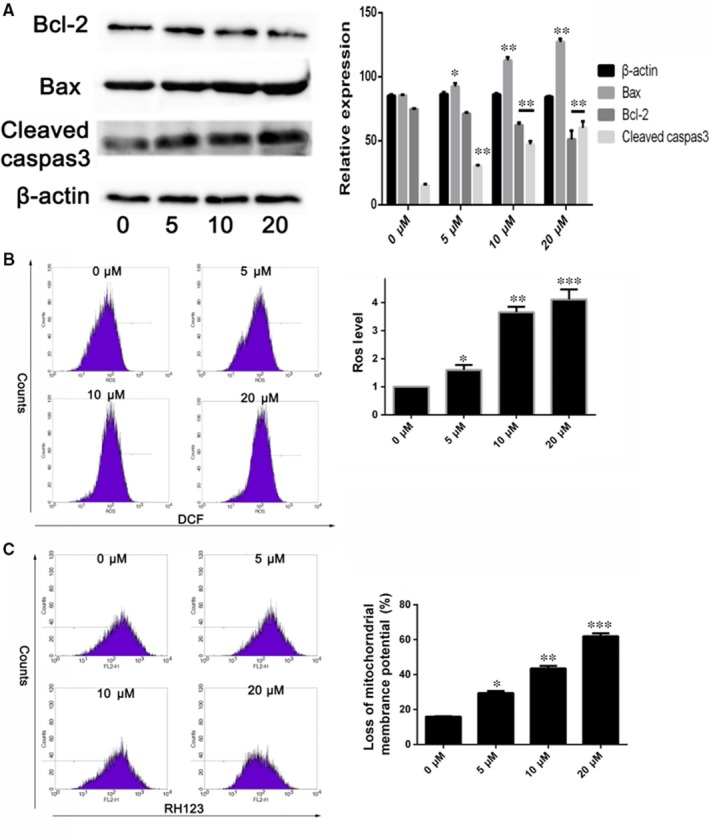
Betulinic acid induces apoptosis of HepG2 cells. A, The levels of anti‐apoptotic Bcl‐2 and pro‐apoptotic Bax and cleaved caspase‐3 in HepG2 cells detected by western blot after treatment with BA (5, 10, 20 μm) and vehicle (0.1% DMSO) for 24 h. B, The change of mitochondrial membrane potential in HepG2 cells induced by BA (5, 10, 20 μm) and vehicle (0.1% DMSO) for 36 h determined by flow cytometry. C, The intracellular ROS level changing in HepG2 cells after treatment with BA (5, 10, 20 μm) and vehicle (0.1% DMSO) were determined by flow cytometry. *P < 0.05, **P < 0.01, ***P < 0.001 vs Control (0 μm) group