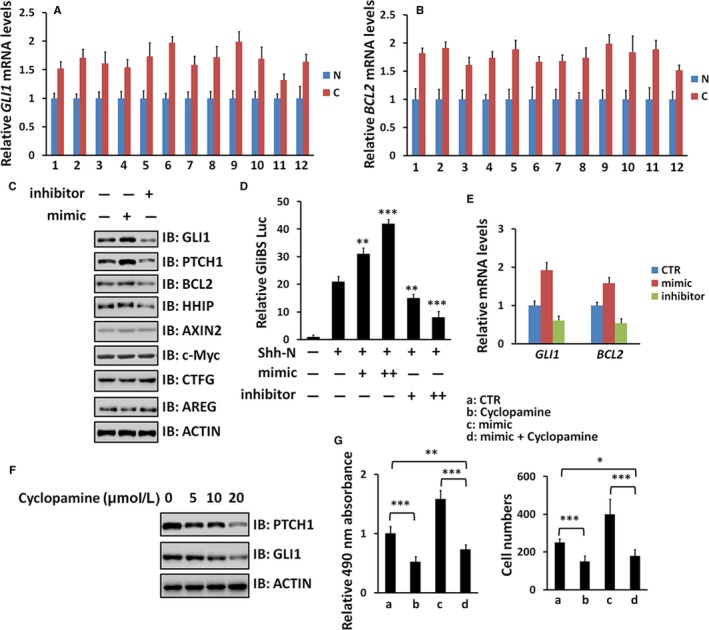
Figure 2.

miR‐520b activates Hh pathway in NSCLC cells. (A, B) Relative mRNA levels of GLI1 and BCL2 from NSCLC samples and matched normal samples were examined by Q‐PCR. (C) WB results of A549 cells with miR‐520b mimic or miR‐520b inhibitor treatment. (D) GliBS‐luciferase reporter assay in A549 cells under indicated treatment. GliBS luciferase activities were normalized to Renilla luciferase activities. (E) Q‐PCR assay to test GLI1 and BCL2 with miR‐520b mimic or miR‐520b inhibitor treatment in A549 cells. (F) WB results of A549 cells treated by Cyclopamine at indicated concentrations. (G) MTT and transwell assays of A549 cells under indicated treatment. All values are mean ± SD (n = 3, *P < 0.05,**P < 0.01 and ***P < 0.001)
