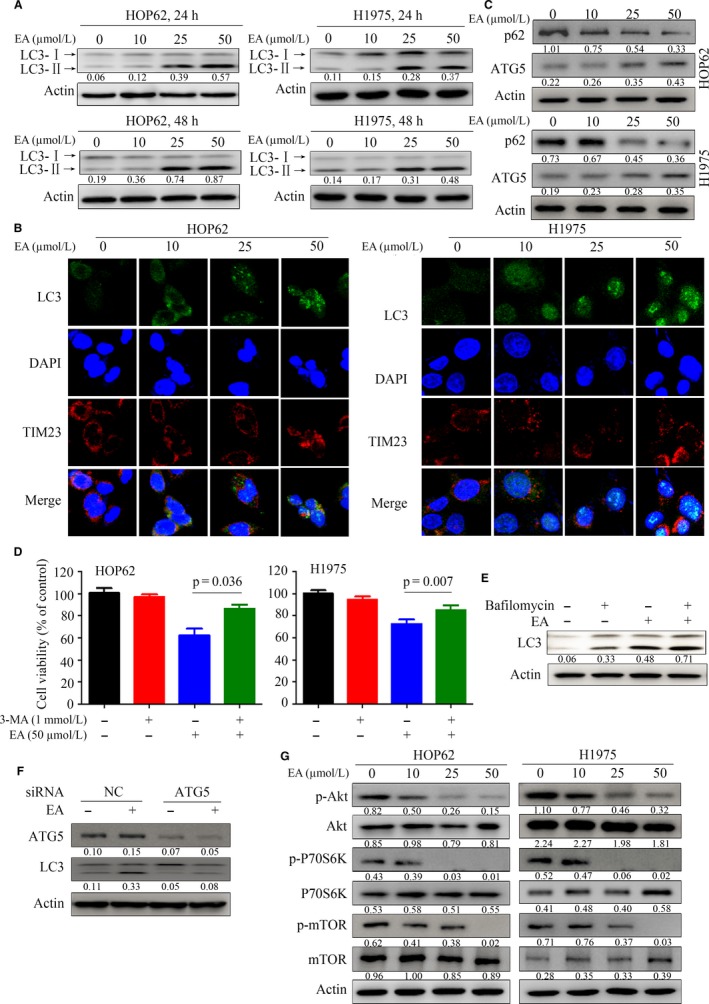
Figure 3.

EA induces autophagy in lung cancer cells. (A) HOP62 and H1975 cells were treated with EA for 24 hours and LC3‐I and LC3‐II levels were analysed by Western blot. Numbers under the bands (LC3‐II for LC3) are the relative expression values to Actin determined by densitometry analysis. (B) HOP62 cells were treated with EA at different concentrations for 24 hours and assessed by immunofluorescence analysis using an anti‐LC3 antibody. (C) Western blot was performed to detect the expression of indicated proteins in HOP62 and H1975 cells treated with EA for 24 hours. (D) The cells were treated with EA and/or 3‐MA, and the viable cells were tested by MTT assay. (E) Western blot assays of lysates of HOP62 cells upon EA/bafilomycin A1 treatment. (F) The HOP62 cells were transfected with siNC or siATG5 and 24 hours later treated with EA for additional 24 hours. The cells were lysed and the lysates were subjected to Western blot using indicated antibodies. (G) Lysates of EA‐treated cells were subjected to Western blot with indicated antibodies. Numbers under the bands are the relative expression values to Actin determined by densitometry analysis
