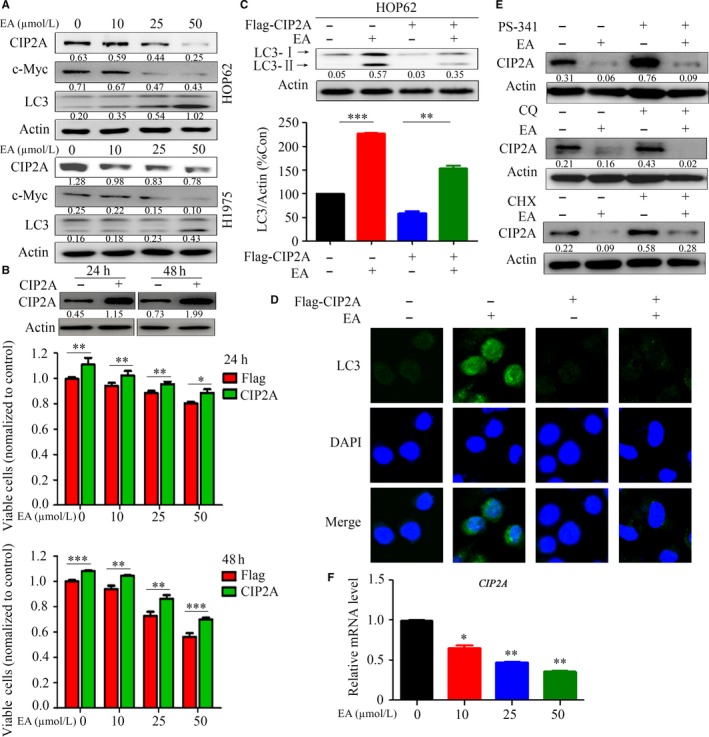
Figure 4.

EA treatment leads to CIP2A down‐regulation and overexpression of CIP2A attenuates EA‐induced autophagy. (A) Western blot analysis of CIP2A, c‐Myc, and LC3 in HOP62 and H1975 cells treated with EA. Numbers under the bands (LC3‐II for LC3) are the relative expression values to Actin determined by densitometry analysis. (B) HOP62 cells were transfected with CIP2A and treated with EA for 24 and 48 hours, and viable cells were detected by the MTT assay. The expression of CIP2A was tested by Western blot assay. Numbers under the bands are the relative expression values to Actin determined by densitometry analysis. (C, D) HOP62 cells were transfected with CIP2A and treated with EA for 24 hours; the cells were subjected to Western blot assays (C) and immunofluorescence analysis (D). Data are presented as the mean ± SD; P‐values were determined with the t test. (E) HOP62 cells were treated indicated compounds for 24 hours, lysed, and the lysates were subjected to Western blot to test the expression of CIP2A. Numbers under the bands (LC3‐II for LC3) are the relative expression values to Actin determined by densitometry analysis. (F) HOP62 cells were treated with EA for 24 hours, harvested, and the expression of CIP2A was detected qPCR. *P < 0.05; **P < 0.01; ***P < 0.001
