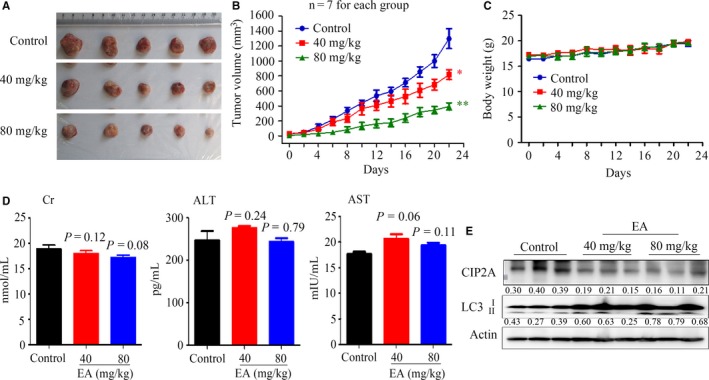
Figure 5.

In vivo anti‐lung cancer efficacy of EA. (A) Images of xenograft tumours obtained from the mice (n = 7 for each group). HOP62 cells were inoculated subcutaneously into the right flank of nude mice, which were treated with the indicated concentrations of EA. (B) Efficacy of EA on tumour growth in nude mice injected with HOP62 cells. Data are presented as the mean ± SEM. P = 0.016 for one‐way ANOVA; P‐values for comparison between control group and each treatment group: *P < 0.05; **P < 0.01. (C) The body weight of mice was monitored every 2 days. (D) The serum levels of Cr, ALT, and AST in mice from each group were detected. (E) Western blot assays using lysates of isolated tumours and indicated antibodies. Numbers under the bands (LC3‐II for LC3) are the relative expression values to Actin determined by densitometry analysis
