Figure 5.

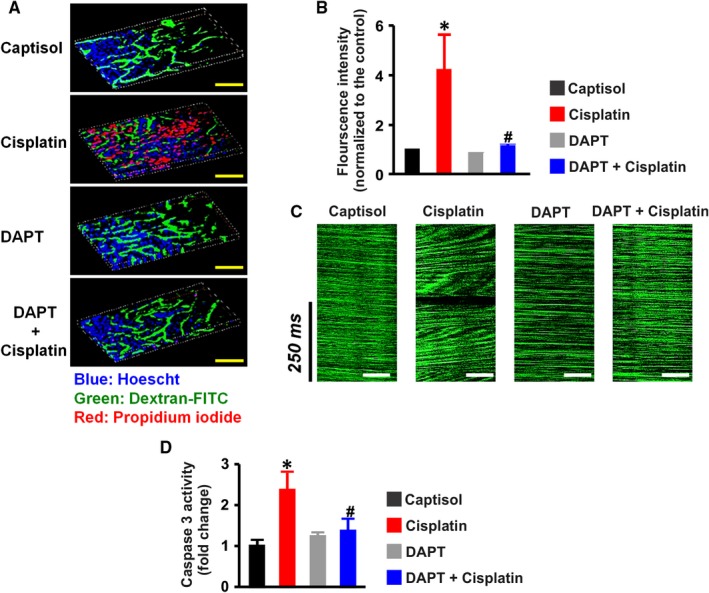
DAPT mitigates cisplatin‐induced necrosis, peritubular vascular dysfunction, and caspase 3 activity in mouse kidneys. A, 3‐D reconstruction of Z‐stack images and B, bar graphs of mean propidium iodide (PI) fluorescence intensity from 2‐photon microscopy of the kidney in anesthetized mice injected with Hoescht, dextran‐FITC, and propidium iodide to label the nuclei, peritubular vessels, and necrotic tubular cells, respectively in Captisol (vehicle control; IP; n = 4)‐, cisplatin (15 mg/kg; IP; n = 5)‐, DAPT (15 mg/kg; IP; n = 5)‐, and DAPT + cisplatin (n = 4)‐treated mice. C, representative line scan images of peritubular capillaries illustrating normal red blood cell velocity (characterized by constant slope) in Captisol‐, DAPT‐, and DAPT + cisplatin‐treated mice, and distorted perfusion (exemplified by variable slope) in cisplatin‐treated mice. D, bar graphs summarizing caspase 3 activity (determined by a colorimetric assay) in the kidneys of Captisol (n = 5)‐, cisplatin (n = 6)‐, DAPT (n = 6)‐, and DAPT + cisplatin (n = 6)‐treated mice; *P < 0.05 vs Captisol; # P < 0.05 vs cisplatin. Scale bar = 500 μm (yellow) and 50 μm (white)
