
Figure 1.
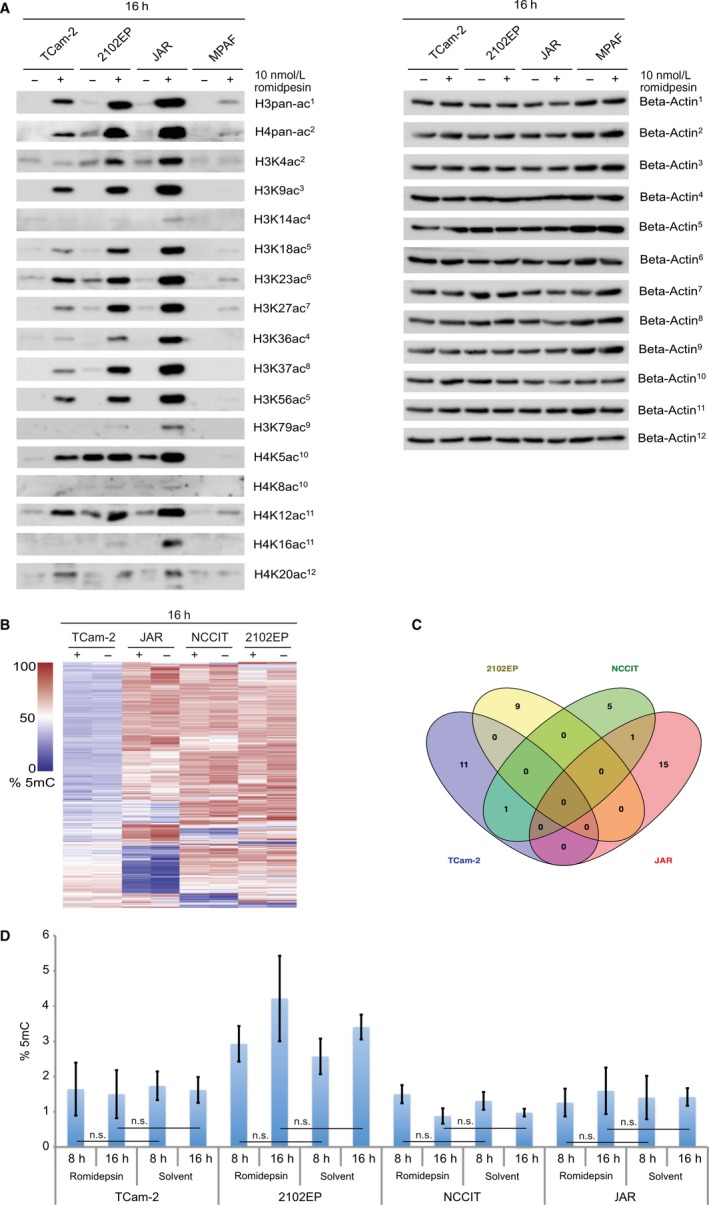
(A) Western blot analysis of lysine acetylation on histones H3 and H4 tails 16 h after 10 nmol/L romidepsin treatment of TCam‐2, 2102EP, JAR and MPAF cells. Beta‐Actin was used as a housekeeper. (B) Heatmap of Illumina 450k DNA methylation microarray data of TCam‐2, 2102EP, NCCIT and JAR cells treated with 10 nmol/L romidepsin (+) or the solvent (−) for 16 h. (C) Venn diagram summarising (common) changes in the DNA methylation landscape of TCam‐2, 2102EP, NCCIT and JAR cells after romidepsin treatment (10 nmol/L romidepsin vs solvent, 16 h). (D) Quantification of 5mC levels in TCam‐2, 2102EP, NCCIT and JAR cells, 8 and 16 h after 10 nmol/L romidepsin or solvent treatment