Figure 3.

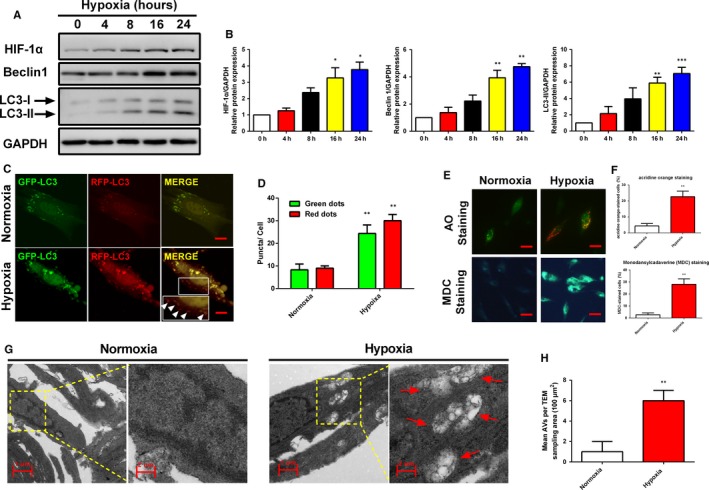
Hypoxia induced autophagy in human endometrial stromal cells. (A‐B) Human endometrial stromal cells were incubated under hypoxic conditions for 0, 4, 8, 16, and 24 h and then analysed by Western blot to determine the expression levels of HIF‐1α,Beclin1, and LC3. (C‐D) Representative images showing LC3 staining in different groups of human endometrial stromal cells infected with GFP‐RFP‐LC3 adenovirus for 24 h (Scale bar: 5 μm). Quantification of mean red and green fluorescent puncta of at least 10 cells per condition is shown. (E‐F) Representative images of human endometrial stromal cells treated with normoxia and hypoxia for 24 h, respectively, and then cells were stained with acridine orange and MDC (Scale bar: 20 μm). The percentage of cells stained for acridine orange or MDC were quantified. (G‐H) Representative images of human endometrial stromal cells incubated with normoxia (left panel) and hypoxia (right panel) for 24 h, and then were analysed by Transmission electron microscopy (TEM). Autophagical vacuoles containing organelle remnants were highlighted by red arrows. The protein expression levels were quantified by Image J software and normalized to GAPDH protein levels. Quantitative results are expressed as the means ± SD of at least three independent experiments (*P < 0.05; **P < 0.01; ***P < 0.001)
