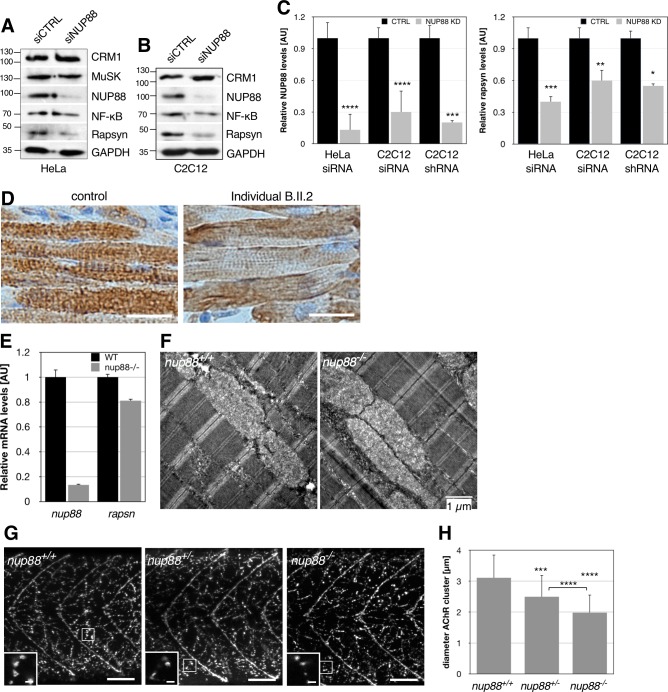
Fig 7. Loss of functional NUP88 affects rapsyn expression as well as AChR clustering.
(A) HeLa and (B) C2C12 cells were treated with the indicated siRNAs for 2 days and cellular lysates were subjected to Western blot analysis using antibodies against NUP88, CRM1, MuSK, NF-kB, and rapsyn. GAPDH was used as loading control. Rapsyn protein levels are reduced in NUP88-depleted cells. Note MuSK has a predicted molecular weight of 97 kDa, but migrates higher [20]. (C) Quantification of the respective expression levels of NUP88 and rapsyn after transfection of HeLa and C2C12 cells with the indicated siRNAs and shRNA-mediated depletion of NUP88 in C2C12 cells. Blots from three independent experiments for each condition were analyzed. Data present mean ± SEM. P-values ****<0.0001, ***<0.001; **<0.01, *<0.05; t-test, one-tailed. (D) Bright-field images of histological muscle sections from individual B.II.2 and a control fetus stained with anti-rapsyn antibodies (brown). Nuclei were visualized by hematoxylin. (E) qRT-PCR analysis of nup88 and rapsn transcripts in 5 dpf wild-type and nup88-/- larvae. (F) Skeletal muscle organization remains unaffected in nup88-/- zebrafish larvae. Larvae were prepared at 5 dpf for transmission electron microscopy. Skeletal muscle of WT and mutant zebrafish show intact myofibril alignment with their regularly stacked Z-line and clearly identifiable H- and I-zones. Shown are representative longitudinal sections of skeletal muscle from nup88+/+ and nup88-/- larvae, respectively. Scale bar, 1 μm. (G) Anterior trunk regions of wild-type (left) and nup88 heterozygous and homozygous mutant larvae were stained with antibodies against the AChR and secondary Alexa 488 antibodies. AChR cluster size was significantly reduced in nup88-/- larvae as compared to nup88+/+ and nup88+/- larvae (higher magnification insets). Insets are taken from the marked area in the respective overview image. Inset for nup88-/- was rotated by 180°. Scale bars, 50 μm (overview), 5 μm (insets). (H) Quantification of the AChR size in 4 dpf nup88+/+ (n = 8), nup88+/- (n = 14), and nup88-/- (n = 12) larvae. Per larvae 100 clusters throughout z-stacks of confocal images were manually measured using ImageJ. Data present mean ± SD. P-values ****<0.0001, ***<0.001; t-test, one-tailed.

