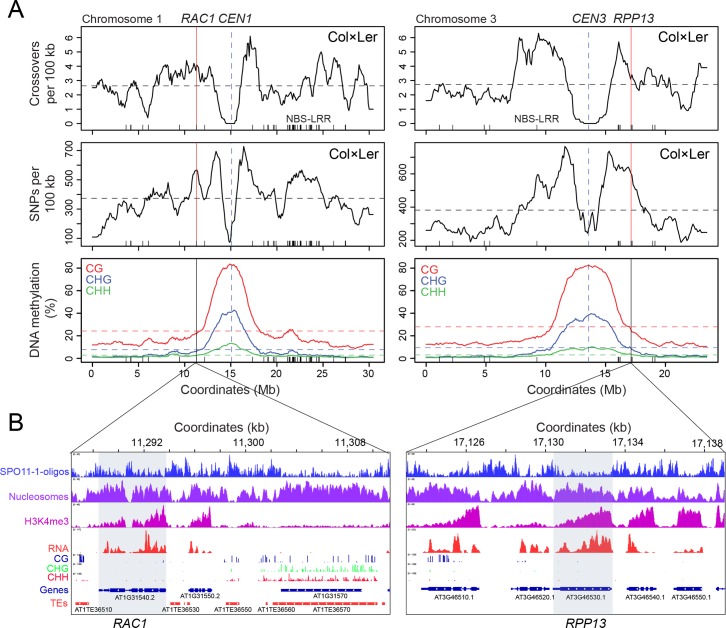
Fig 1. Chromatin and recombination landscapes around the RAC1 and RPP13 NBS-LRR disease resistance genes.
(A) Crossover frequency (crossovers/100 kb mapped by genotyping-by-sequencing of Col×Ler F2) [50,60], interhomolog divergence (Col/Ler SNPs/100 kb) [63], and % DNA methylation (CG red, CHG blue, CHH green) [64], along chromosomes 1 and 3. Vertical dotted lines indicate the centromeres. Mean values are indicated by horizontal dotted lines. NBS-LRR gene positions are indicated by ticks on the x-axis. The position of RAC1 and RPP13 are indicated by the solid vertical lines. (B) Histograms for the RAC1 and RPP13 regions showing library size normalized coverage values for SPO11-1-oligonucleotides (blue), nucleosome occupancy (purple, MNase-seq), H3K4me3 (pink, ChIP-seq), RNA-seq (red) and % DNA methylation (BSseq) in CG (blue), CHG (green) and CHH (red) sequence contexts [64,66]. Gene (blue) and transposon (red) annotations are highlighted, and the positions of RAC1 and RPP13 are indicated by grey shading.

