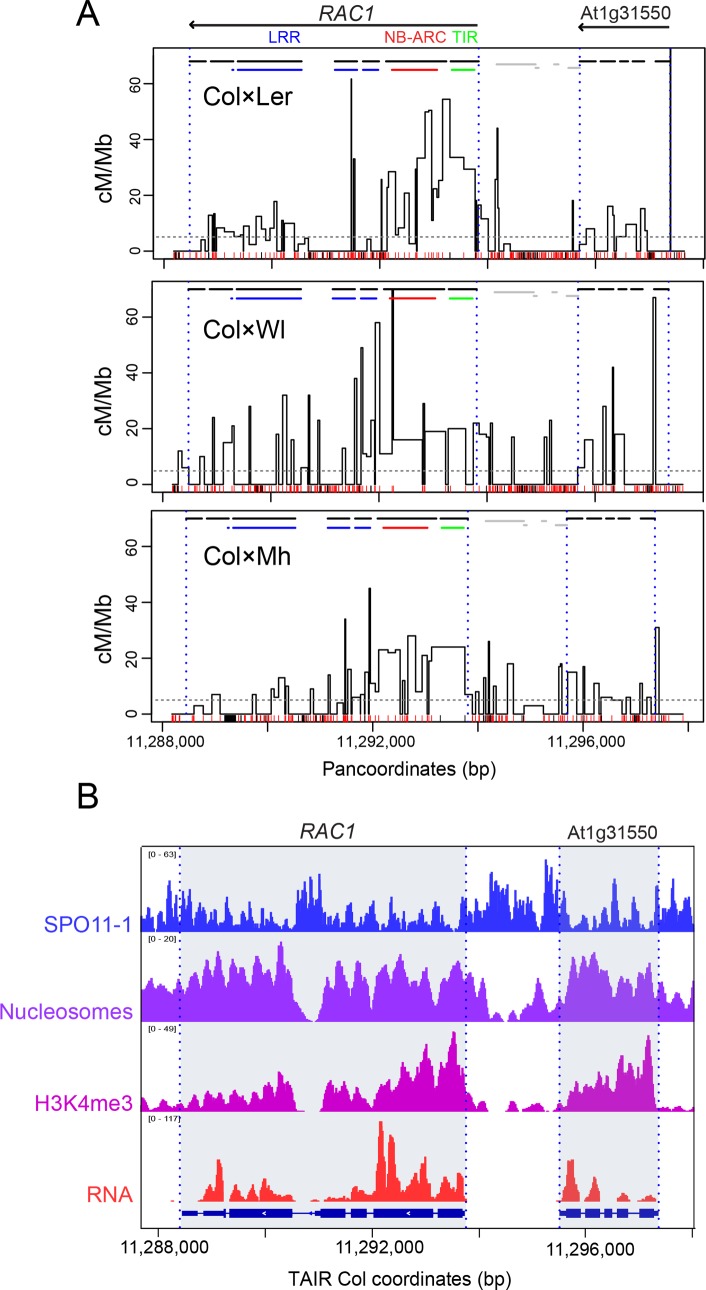
Fig 3. RAC1 crossover hotspots in Col×Ler, Col×Wl and Col×Mh hybrids.
(A) Crossover frequency (cM/Mb) within the region of the RAC1 disease resistance gene measured using titration and sequencing of single crossover molecules from Col×Ler (0.074 cM), Col×Wl (0.074 cM) and Col×Mh (0.064 cM) pollen F1 genomic DNA. Recombination is plotted against the panmolecules, which include all bases from both parental accessions. Gene TSS/TTS are indicated by vertical dotted lines and exons by horizontal black lines. The position of RAC1 TIR (green), NB-ARC (red) and LRR (blue) domain-encoding sequences are indicated by the colored horizontal lines. SNPs (red) and indels (black) are indicated by the ticks on the x-axis. The horizontal dotted line indicates the genome-average recombination rate from male Col×Ler crosses [74]. (B) Histograms for the RAC1 region showing library size normalized values for SPO11-1-oligonucleotides (blue), nucleosome occupancy (purple, MNase-seq), H3K4me3 (pink, ChIP-seq) and RNA-seq (red) [60,64,66]. The positions of RAC1 and GDSL (At1g31550) are indicated by grey shading.

