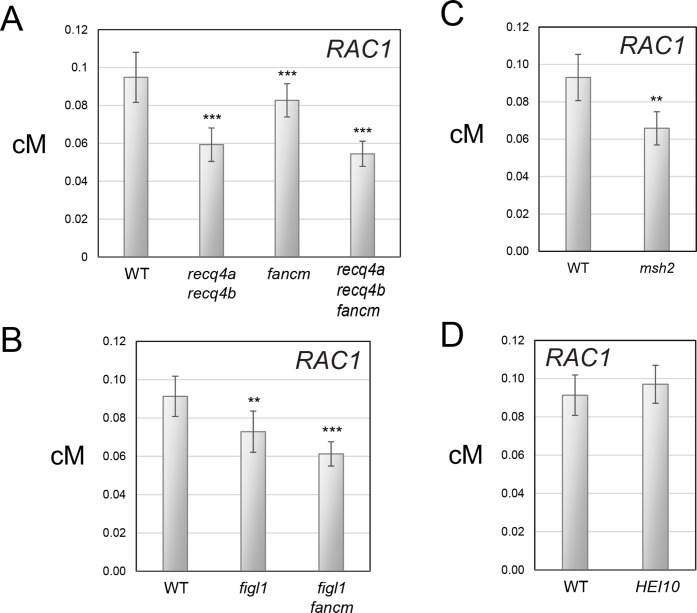
Fig 5. RAC1 genetic distance in backgrounds with altered meiotic recombination pathways.
(A) Barplots showing RAC1 genetic distance (cM) measured in wild type, recq4a recq4b, fancm and recq4a recq4b fancm using single crossover and parental molecule titration. Error bars represent measurement standard deviation (square root of the variance). To test for differences the mean number of crossovers and parental molecules per μl were used to construct 2×2 contingency tables and Chi-square tests performed. The significance indicators ** and *** report a P-value of between 0.01–0.0001 and <0.0001, respectively. (B). As for (A), but showing data for wild type, figl1 and figl1 fancm. (C) As for (A), but showing data for wild type and msh2. (D) As for (A), but showing data for wild type and HEI10.

