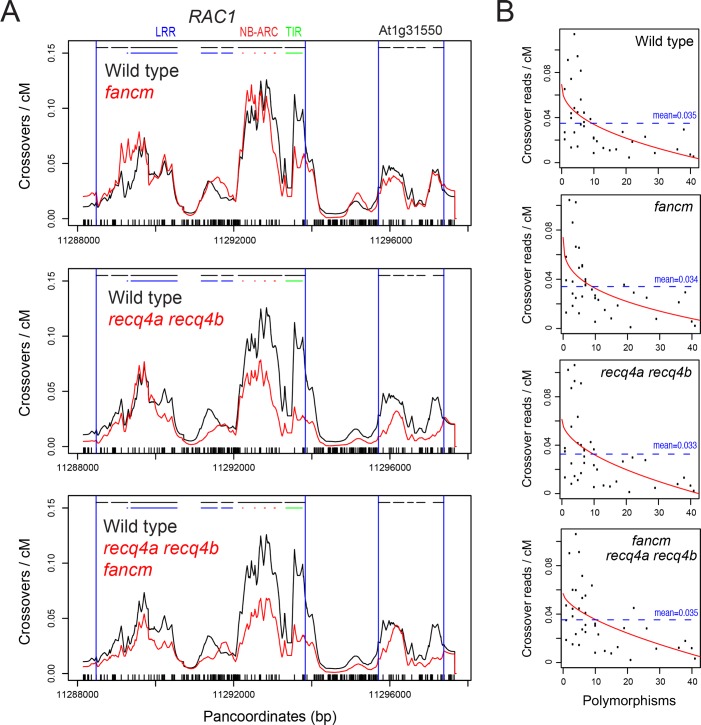
Fig 6. Crossover frequency across RAC1 in wild type and fancm, recq4a recq4b and fancm recq4a recq4b mutants.
(A) The coverage of crossover reads aligned against the Col×Ler panmolecule was calculated and normalized by the total number of reads analysed, and also normalized by RAC1 genetic distance (cM) measured previously by titration. Col×Ler polymorphisms are indicated by black ticks on the x-axis. Gene TSS and TTS are indicated by vertical blue lines, and exons by horizontal black lines. In each plot wild type (black) is plotted alongside mutant backgrounds (red), which are either fancm, recq4a recq4b or recq4a recq4b fancm. (B) 250 base pair adjacent windows were used to calculate the values of crossover reads/cM and polymorphisms (SNPs = one, indels = length) and plotted. The fitted line (red) was generated using the the non-linear model y = log(a) + b×x^(-c). y is reads/cM, x is polymorphisms, a is the intercept and b and c are scale parameters. The dotted horizontal line indicates the mean level of crossover reads/cM within the analysed region.

