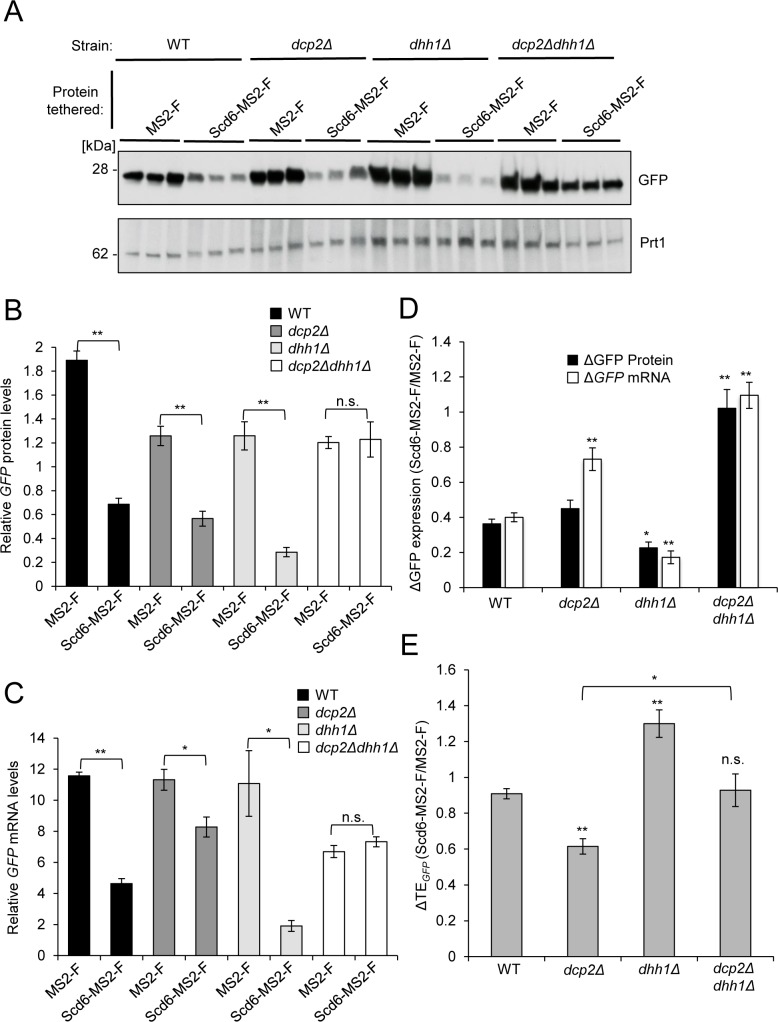
Fig 2. Evidence that translational repression of the GFP reporter by tethered Scd6-MS2-F is coupled to mRNA turnover via Dcp2 and requires Dhh1 in vivo.
(A-C) Transformants of WT (HFY114), dcp2Δ (CFY1016), dhh1Δ (YQZ127), or dcp2Δdhh1Δ (QZY128) strains (isogenic in the W303 background) harboring expression plasmids for MS2-F (pQZ130] or Scd6-MS2-F (pQZ127) and GFP reporter pJC429, were analyzed for reporter protein (A-B) and mRNA (C) expression as in Fig 1B–1D. Mean values (± S.E.M.s) from three different biological replicates per group are shown. (D-E) Changes in expression of GFP reporter protein or mRNA (D), or in TE (E), on tethering Scd6-MS2-F versus MS2-F for the strains analyzed in panels A-C, reported as in Fig 1F. Mean values (± S.E.M.s) were determined from at least three biological replicates. Calculations of S.E.M.s for changes in mean ratios of GFP protein and mRNA expression shown in (D), and determination of P-values from significance testing of differences in mean values in (B-E) using an unpaired Student’s t-test, were conducted as described in the supporting file S1 Text “Analysis and Explanation of Supporting Data Files”. P-values are summarized as: **, P <0.01; *, P <0.05; n.s., not significant. In (E), the entries directly above the bars in cols. 2–3 refer to differences in mean values between the indicated mutants vs. WT (col. 1).

