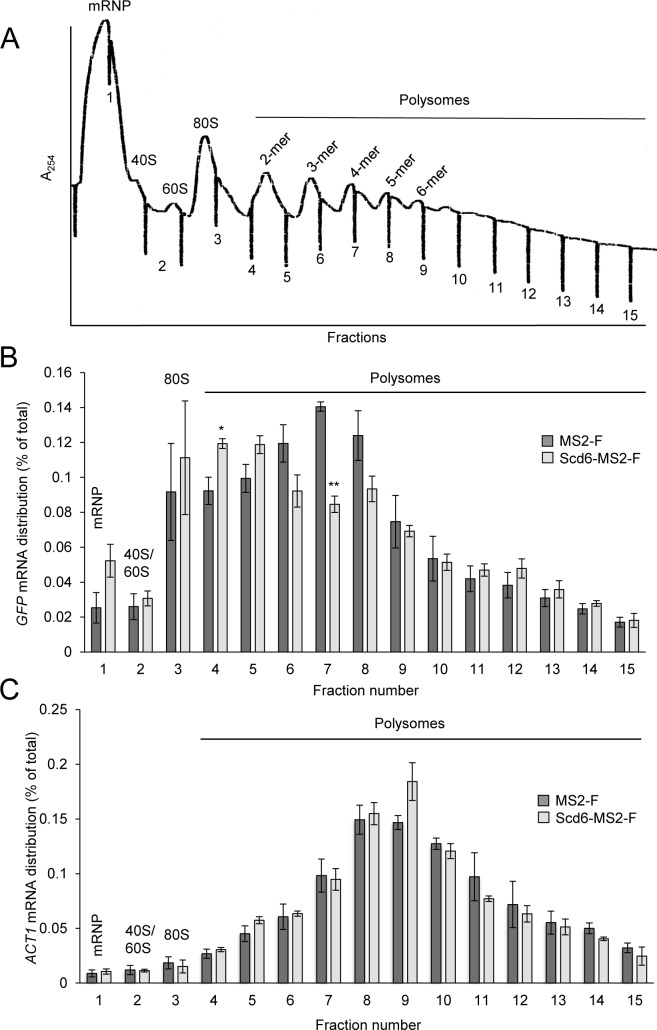
Fig 3. Polysome size distribution of GFP reporter mRNA is altered on tethering Scd6-MS2-F.
(A-C) dcp2Δ transformants from Fig 2A harboring the GFP reporter and expressing Scd6-MS2-F or MS2-F were cultured as in Fig 1B and WCEs were separated by velocity sedimentation on sucrose density gradients and fractionated with continuous monitoring at A254. A representative profile is shown in (A). The abundance of GFP mRNA (B) or ACT1 mRNA (C) was quantitated by RT-qPCR in total RNA extracted from the gradient fractions and plotted as the percentage of total RNA signal in the gradient summed across all fractions. Average results (and ±S.E.M.s) from three biological replicates are shown, which are presented in S4A and S4B Fig. An unpaired Student’s t-test showed that the proportions of mRNA in fractions 7 and 4, representing 4-mers and 1- to 2-mer polysomes, respectively, differed significantly between the Scd6-MS2-F vs. MS2-F transformants, with P-values summarized as: **, P <0.01; *, P <0.05.

