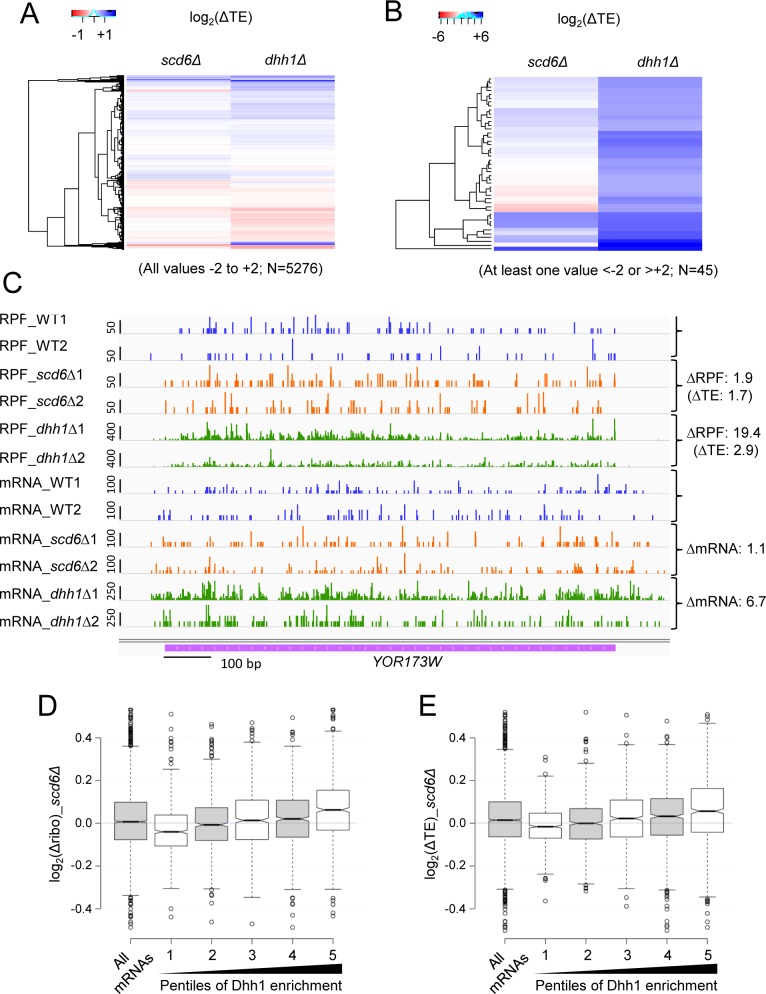
Fig 8. Scd6 and Dhh1 cooperate in repressing translational efficiencies of a subset of native mRNAs in a manner associated with elevated Dhh1 occupancies.
(A-B) Hierachical clustering analysis conducted with the R heatmap.2 function from the R gplots library, using the default “hclust” hierarchical clustering algorithm, using ribosome profiling data from scd6Δ (SYY2353), dhh1Δ (QZY126, dhh1Δ(z)), and WT (HFY114) strains. Approximately 50 genes were removed for which no data were available in one of the strains, or where the log2(ΔTE) value was >4 or <-4 in one of the mutant vs. WT comparisons, after which separate clustering analysis was performed on two sets of mRNAs in which all log2(ΔTE) values fell between -2 or +2 (panel A, 5276 mRNAs), or in which the log2(ΔTE) value in one of the mutants was < -2 or > +2 (panel B, 45 mRNAs). The color key for log2(ΔTE) values is indicated above each analysis. (C) Exemplar gene exhibiting increased TE in both scd6Δ and dhh1Δ versus WT cells. Integrated Genomics Viewer (Broad Institute) display of ribosome-protected fragments (RPFs) and mRNA reads across the YOR173W gene from two biological replicates each for WT, scd6Δ and dhh1Δ strains, shown in units of rpkm (reads per 1000 million mapped reads). Position of the CDS (magenta) is at the bottom with the scale in bp; scales of rpkm for each track are on the left, and calculated ΔRPF, ΔmRNA and ΔTE values between each mutant and WT are on the right. (D-E) Boxplot analysis of changes in ribosome occupancy or TE versus Dhh1 occupancy. Dhh1 RIP-seq enrichment values from Miller et al (2018) were equally divided into five pentiles of 739 genes from lowest to highest values and plotted against the log2(Δribo) values (D) or log2(ΔTE) values (E) determined by ribosome profiling analysis of scd6Δ strain SYY2353 and WT strain HFY114. The Pearson correlation coefficients for the relationship between log2(Δribo) values (panel D) or log2(ΔTE) values (panel E) and Dhh1 enrichment for all mRNAs are 0.2 (P = 2 X 10⁻³⁴) and 0.16 (P = 2 X 10⁻²²), respectively.

