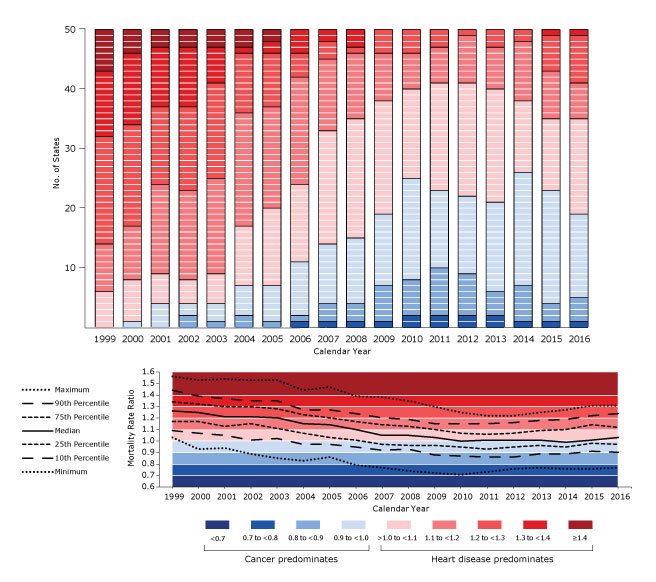
Figure 2.
Frequency of categories of state-specific mortality rate ratios (MRRs), calculated by dividing the mortality rate of heart disease by the mortality rate for cancer, among all ages, both sexes, and all races and ethnicities, United States, 1999–2016. Top, number of states in each category of MRR, by calendar year. Each cell represents 1 state. Bottom, summary statistics by calendar year.
| Category | Calendar Year |
|||||||||||||||||
|---|---|---|---|---|---|---|---|---|---|---|---|---|---|---|---|---|---|---|
| 1999 | 2000 | 2001 | 2002 | 2003 | 2004 | 2005 | 2006 | 2007 | 2008 | 2009 | 2010 | 2011 | 2012 | 2013 | 2014 | 2015 | 2016 | |
| No. of states in each MRR category | ||||||||||||||||||
| >1.0 (heart disease predominates) | 50 | 49 | 46 | 46 | 46 | 43 | 43 | 39 | 36 | 35 | 31 | 25 | 27 | 28 | 29 | 24 | 27 | 31 |
| ≥1.4 | 7 | 4 | 3 | 3 | 3 | 3 | 2 | 0 | 0 | 0 | 0 | 0 | 0 | 0 | 0 | 0 | 0 | 0 |
| 1.3 to <1.4 | 11 | 12 | 10 | 10 | 6 | 1 | 2 | 4 | 2 | 3 | 0 | 0 | 0 | 0 | 0 | 0 | 1 | 1 |
| 1.2 to <1.3 | 18 | 17 | 13 | 14 | 16 | 10 | 9 | 4 | 3 | 1 | 4 | 4 | 3 | 1 | 3 | 2 | 6 | 8 |
| 1.1 to <1.2 | 8 | 9 | 15 | 15 | 16 | 19 | 17 | 18 | 12 | 11 | 8 | 6 | 6 | 8 | 7 | 10 | 8 | 6 |
| >1.0 to <1.1 | 6 | 7 | 5 | 4 | 5 | 10 | 13 | 13 | 19 | 20 | 19 | 15 | 18 | 19 | 19 | 12 | 12 | 16 |
| <1.0 (cancer predominates) | 0 | 1 | 4 | 4 | 4 | 7 | 7 | 11 | 14 | 15 | 19 | 25 | 23 | 22 | 21 | 26 | 23 | 19 |
| 0.9 to <1.0 | 0 | 1 | 4 | 2 | 3 | 5 | 6 | 9 | 10 | 11 | 12 | 17 | 13 | 13 | 15 | 19 | 19 | 14 |
| 0.8 to <0.9 | 0 | 0 | 0 | 2 | 1 | 2 | 1 | 1 | 3 | 3 | 6 | 6 | 8 | 7 | 4 | 6 | 3 | 4 |
| 0.7 to <0.8 | 0 | 0 | 0 | 0 | 0 | 0 | 0 | 1 | 1 | 1 | 1 | 2 | 2 | 2 | 2 | 1 | 1 | 1 |
| <0.7 | 0 | 0 | 0 | 0 | 0 | 0 | 0 | 0 | 0 | 0 | 0 | 0 | 0 | 0 | 0 | 0 | 0 | 0 |
| MRR summary statistic | ||||||||||||||||||
| Maximum | 1.56 | 1.53 | 1.54 | 1.53 | 1.53 | 1.44 | 1.47 | 1.39 | 1.38 | 1.35 | 1.30 | 1.25 | 1.22 | 1.22 | 1.25 | 1.27 | 1.31 | 1.31 |
| 90th Percentile | 1.44 | 1.39 | 1.37 | 1.35 | 1.35 | 1.27 | 1.27 | 1.24 | 1.20 | 1.19 | 1.15 | 1.15 | 1.15 | 1.16 | 1.18 | 1.19 | 1.22 | 1.24 |
| 75th Percentile | 1.34 | 1.32 | 1.30 | 1.30 | 1.28 | 1.23 | 1.20 | 1.17 | 1.14 | 1.13 | 1.10 | 1.07 | 1.06 | 1.07 | 1.09 | 1.10 | 1.14 | 1.12 |
| Median | 1.26 | 1.25 | 1.21 | 1.21 | 1.20 | 1.15 | 1.14 | 1.10 | 1.05 | 1.05 | 1.03 | 1.00 | 1.01 | 1.01 | 1.01 | 0.99 | 1.01 | 1.03 |
| 25th Percentile | 1.17 | 1.17 | 1.13 | 1.15 | 1.11 | 1.07 | 1.03 | 1.01 | 0.97 | 0.96 | 0.96 | 0.95 | 0.93 | 0.95 | 0.96 | 0.95 | 0.98 | 0.97 |
| 10th Percentile | 1.09 | 1.07 | 1.05 | 1.01 | 1.02 | 0.97 | 0.97 | 0.95 | 0.92 | 0.93 | 0.88 | 0.87 | 0.86 | 0.86 | 0.89 | 0.89 | 0.91 | 0.90 |
| Minimum | 1.03 | 0.93 | 0.94 | 0.89 | 0.85 | 0.83 | 0.86 | 0.79 | 0.77 | 0.74 | 0.72 | 0.71 | 0.73 | 0.76 | 0.77 | 0.76 | 0.76 | 0.77 |

