Figure 1.

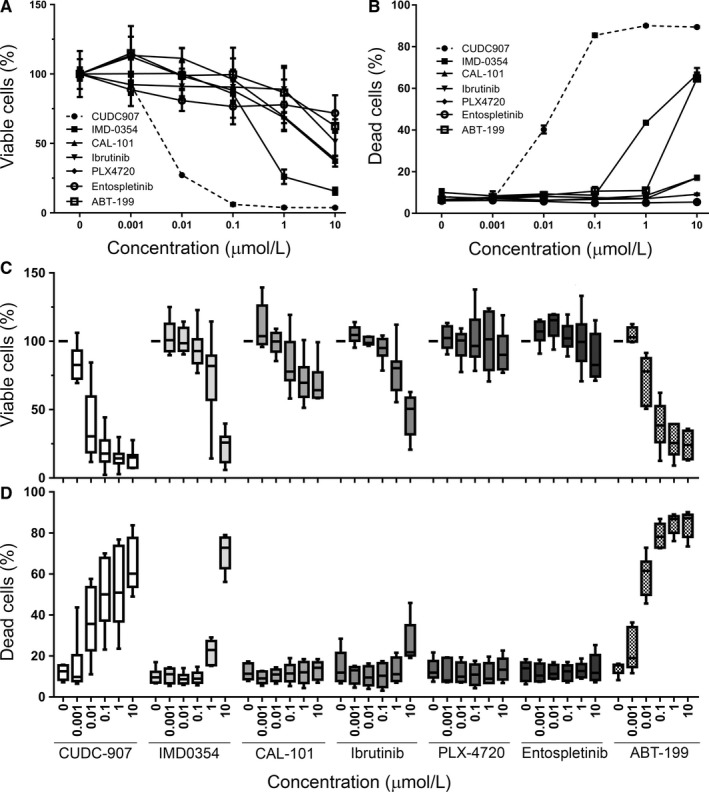
CUDC‐907 inhibits CLL cell growth and induces apoptosis. A, MEC‐1 cell viability measured by MTS assay, normalized to Control samples (0 μmol/L). Cells were treated with various small molecule inhibitors (0.001‐10 μmol/L) or DMSO (0 μmol/L) for 48 h. Experiments were performed in triplicate and repeated at least 2 times. Graphics show mean values and error bars represent standard deviation, as in all the other panels of this figure. B, Induction of cell death in MEC‐1, as measured by FACS analysis of by PI‐stained cells. Cells were treated with inhibitors for 48 h. Graphics show percentage of PI positive (dead) cells. C, Same as (A), using primary CLL cells. Cells were cultured for 24 h in the presence of 10 ng/mL IL‐4 and CD154 and then treated with inhibitors for 48 h. The number of primary samples used for each inhibitor is: 23 (CUDC‐907), 13 (IMD0354), 6 (CAL‐101), 11 (Ibrutinib), 8 (PLX‐4720), 6 (Entospletinib), and 7 (ABT‐199). Experiments were performed in triplicate. Graphics show mean values and error bars represent standard deviation. D, Same as (B), using primary CLL cells. The number of primary samples used for each inhibitor are: 8 (CUDC‐907), 6 (IMD0354), 5 (CAL‐101), 5 (Ibrutinib), 5 (PLX‐4720), 5 (Entospletinib), and 5 (ABT‐199)
