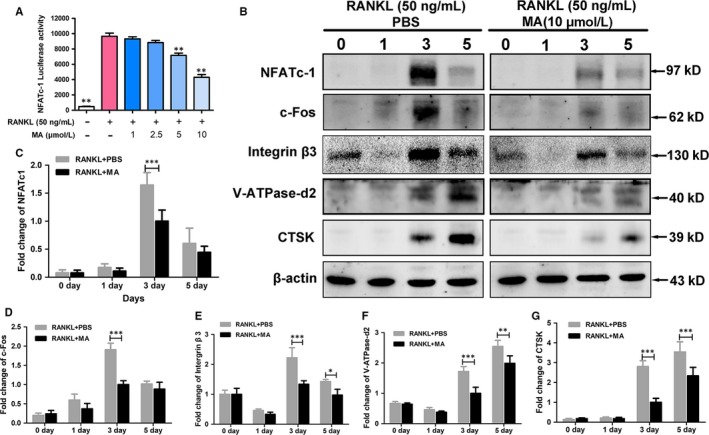
Figure 5.

Madecassoside (MA) represses NFATc1 activity and downstream protein expression. (A) The bar graph depicts the NFATc1 luciferase activity of RAW264.7 cells stably transfected with an NFATc1 luciferase reporter construct. Cells were treated with varying densities of MA and stimulated by GST‐rRANKL (50 ng/mL) for 24 h. (B)The protein expression of NFATc1, c‐Fos, V‐ATPase‐d2, CTSK, integrin β3 at day 0, day 1, day 3, and day 5 after stimulation by GST‐rRANKL (50 ng/mL) with or without MA (10 μmol L−1). (C‐G) The statistical significance of differences in protein expression between the MA‐treated group and control group was analysed. The expression of all the proteins mentioned above was determined relative to β‐actin expression. The data represent the means ± SD. Significant differences between the treatment and control groups are indicated as *P < 0.05, **P < 0.01, and ***P < 0.001
