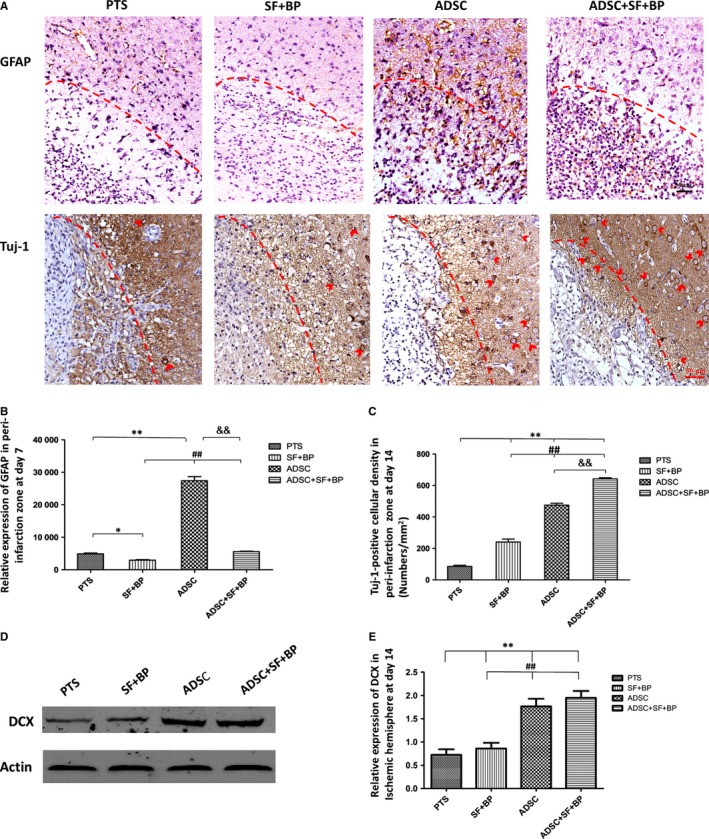
Figure 5.

Modulation of astrocyte activation and neurogenesis after treatment. A, Representative images of GFAP and Tuj1 expression presented by immunohistochemical staining. B, The relative expression of GFAP and (C) the density of Tuj1+ cells in the infarct zone were calculated. D, Representative Western blot results for DCX in ischaemic hemisphere and quantitative analysis. Data are expressed as means ± SD. *P < 0.05, **P < 0.01, compared with PTS group; ## P < 0.01, compared with SF + BP group; && P < 0.01, compared with ADSC group. N = 6 (for immunohistochemical staining), N = 3 (for Western blot), scale bar: 50 μm
