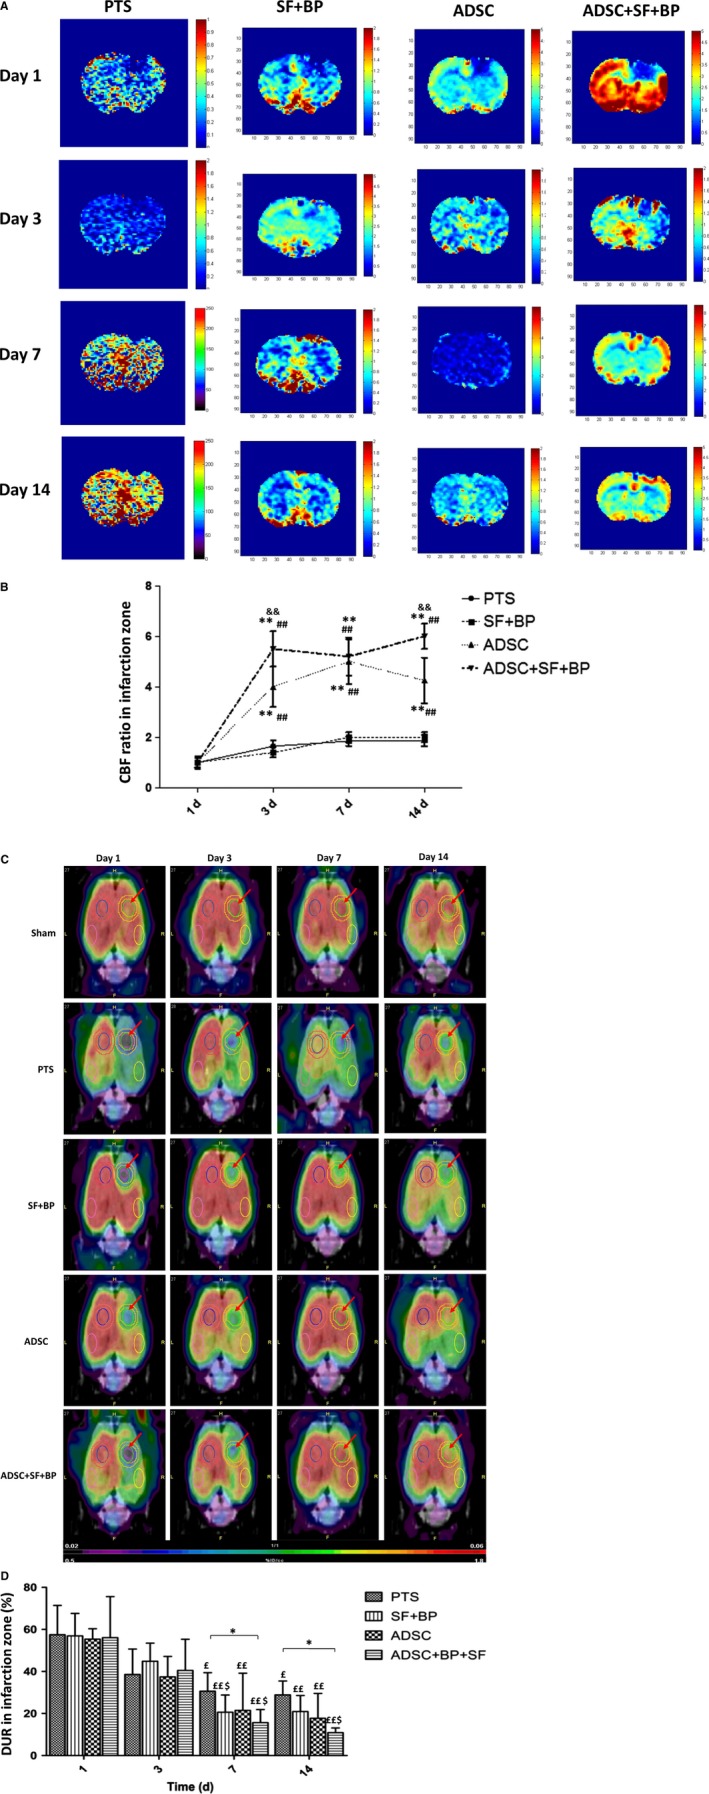
Figure 6.

Evolutional change of cerebral blood flow and glucose metabolism in the infarct zone. (A) and (C) represent the images of PWI/MRI and 18F‐FDG/PET at day 1, 3, 7, and 14 after stroke with or without treatment. Quantitative analysis showed that ADSC + SF + BP treatment restored rCBF more rapidly B, and enhanced glucose metabolism more efficiently (C) as compared with other three groups. Data were expressed as means ± SD. *P < 0.05, **P < 0.01, compared with group PTS; ## P < 0.01, compared with SF + BP group, && P < 0.01, compared with ADSC group, £ P < 0.05, ££ P < 0.01, compared with day 1, $ P < 0.05, $$ P < 0.01, compared with day 3. N = 6
