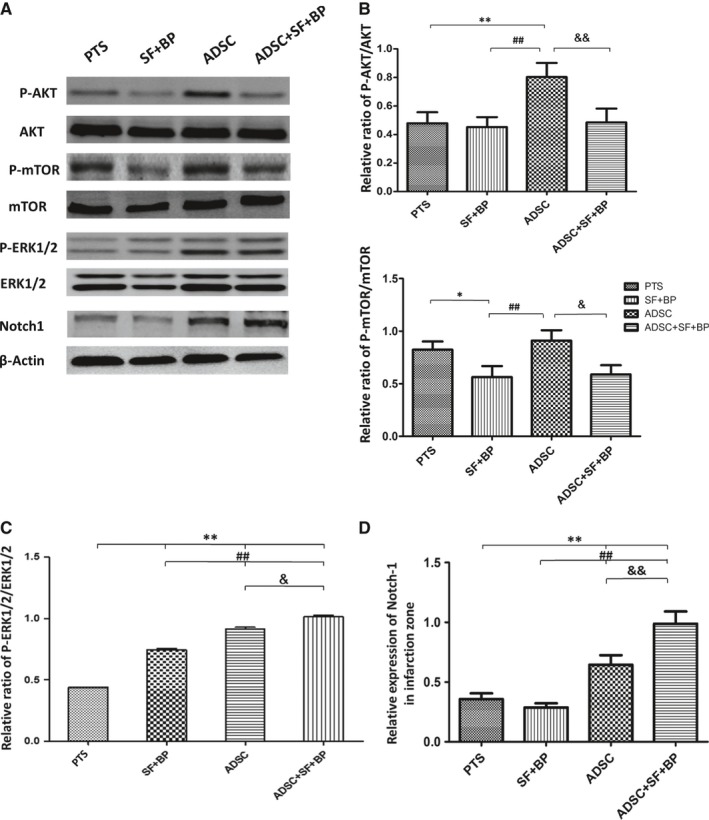
Figure 8.

Regulations of AKT/mTOR, ERK1/2 and Notch1 signalling pathways in infarcted region. A, Result of western blot for p‐Akt, Akt, p‐mTOR, mTOR, p‐ERK1/2, ERK1/2, and Notch1. (B‐D) Quantitative analysis showed that combined ADSC + SF + BP treatment activated ERK1/2 and Notch1 cascades and suppressed AKT/mTOR signalling. Data are expressed as mean ± SD. *P < 0.05, **P < 0.01, compared with PTS group, ## P < 0.01, compared with SF + BP group, && P < 0.01, compared with ADSC group. N = 3
